It turns out that “voting for the lesser of two evils” is a recent invention in presidential elections. We’ve seen dissenting liberals in wartime and disaffected conservatives amid stagflation, but there rarely has been overlapping dissatisfaction since the 1950s.
That changed sometime on either side of the Clinton administration. The polarized 21st century of American politics—which began with a second-place finisher in the popular vote as commander-in-chief—has seen the formation of a hardened, dissatisfied electorate that transcends one ideology or party. According to data, the levels of intense disfavor shown toward the major party presidential nominees have increased and become comparable among Democrats and Republicans. It has resulted—and culminated, one can only hope—in an expected matchup between two unusually unpopular candidates. In the aggregate, their disapprobation from the public is historically high.
First, take a look at the “highly unfavorable” ratings of the Democratic and Republican nominees since 1956. This measure, which is from Gallup, gauges the percentage of respondents who give a candidate a -4 or a -5 on a sliding scale between -5 and +5. The more negative the number, the stronger the disapproval. Data from Gallup are available for every election since ’56 except 1988, 1996 and 2000.
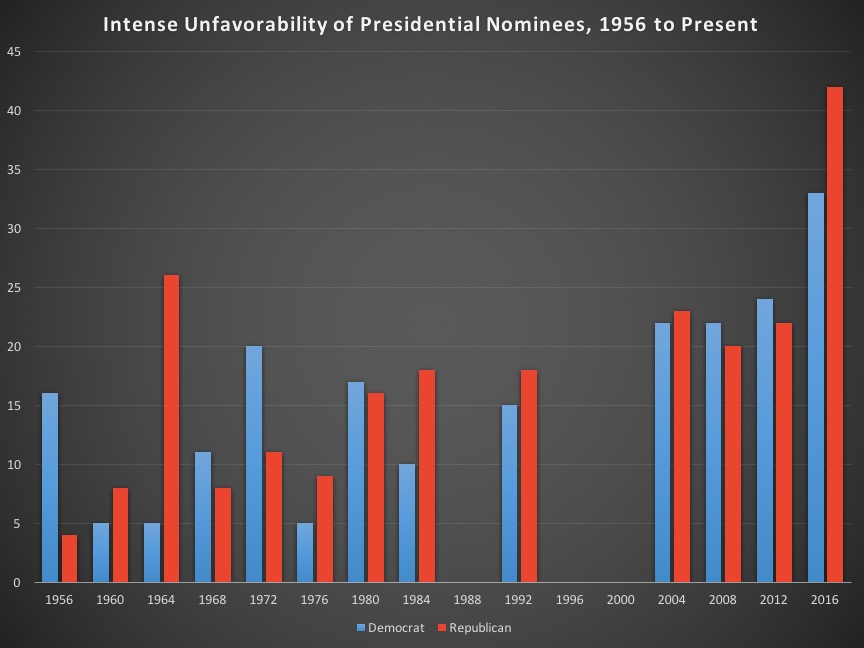
Notice first how the Republican in 1964, Barry Goldwater, is the only candidate before 2004 to exceed 20 percent in his highly unfavorable figure. For the purposes of evaluating 20th century elections that have the relevant data, it’s an outlier.
Second, notice how the gaps between the Democrat and the Republican begin to vanish over time, and how it becomes a consistent phenomenon in 2004. It’s also worth noting that the percentage difference has shrunk, in particular; while the Republican was more popular than the Democrat by three points in both 1984 and 1960, for example, there’s a much smaller difference between 18 percent and 15 percent than there is 8 percent and 5 percent.
To provide a better look of how public displeasure has ramped up like a roller coaster’s first incline, here’s a chart of the same data sans Goldwater—again, because he’s the outlier.
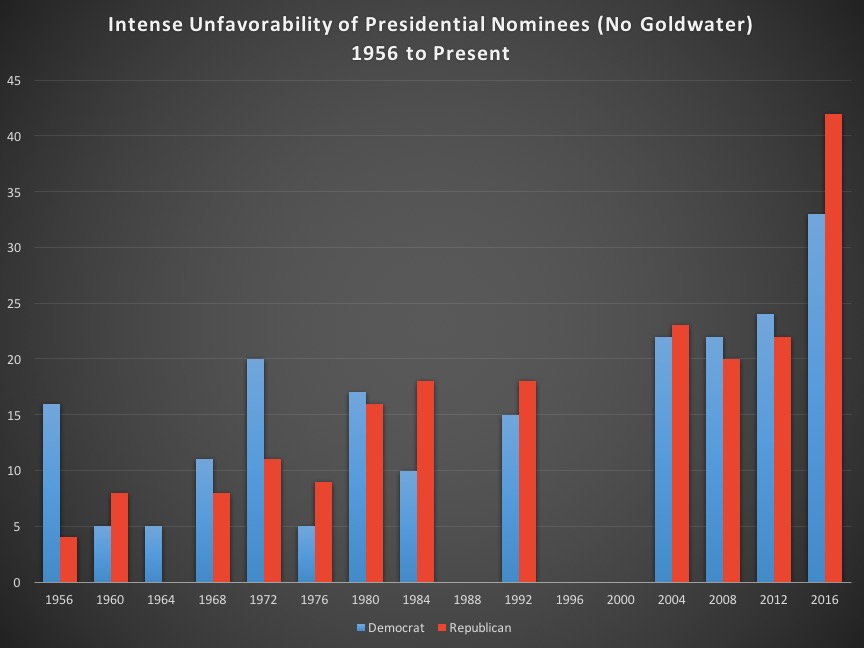
The big takeaway here: Whereas 20 percent is a ceiling of a candidate’s highly unfavorable rating before 2000, it becomes a floor afterward. Roughly a fifth of the public had a strongly negative opinion of each of the nominees in the three presidential contests before this one. That means the aggregate unfavorable statistic—the combined disfavor of the two candidates—became particularly high this century, and has reached a remarkably steep height in 2016.
Here is a graph of the highly unfavorable numbers of the two nominees each year stacked on top of each other.
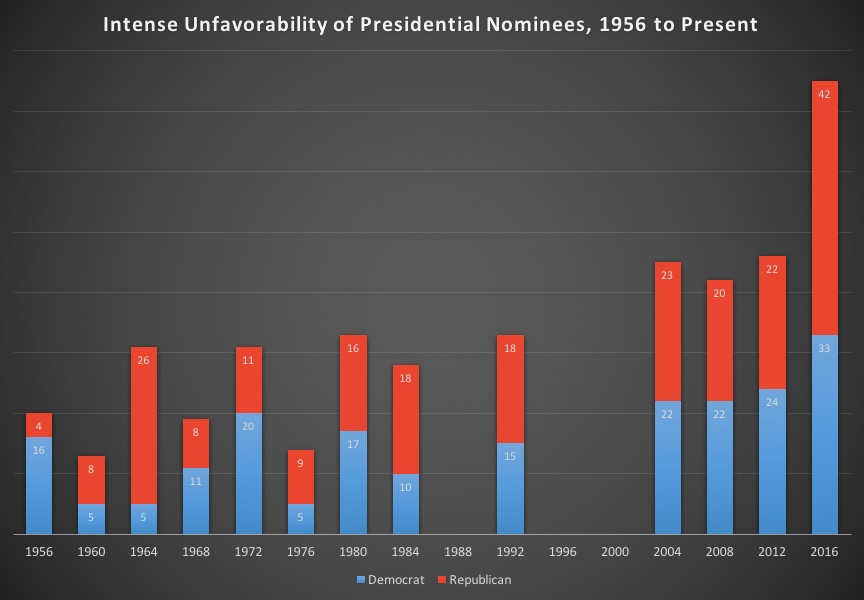
There’s a wrong way and a right way to evaluate this. The wrong way is to assume that 75 percent of Americans have intense antipathy toward either Clinton or Trump. (Thus why there aren’t any numbers on the y-axis, or the vertical line on the graph’s left side, for the purposes of not being misleading.) The stacked bars are still separate colors for a reason. It’s possible—and in this charged environment, likely—that there’s at least a little bit of overlap between the two groups; some people who intensely dislike Clinton also intensely dislike Trump.
Instead, this is a useful ballpark visualization of how Americans have come to give their presidential nominees stronger negative feedback with the passage of time. In the context of the numbers, describing an election as a choice between the lesser of two evils has never been truer.