
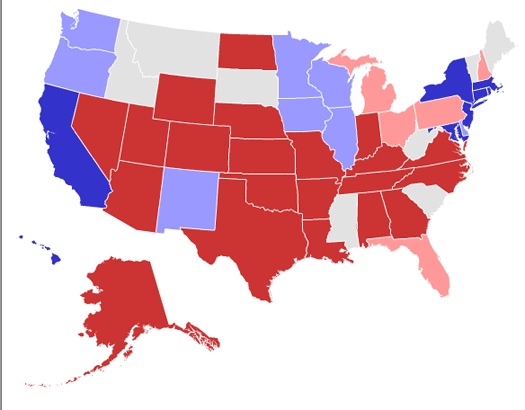
According to Sean Trende at Real Clear Politics, this is how President Obama’s approval ratings look on a state-by-state basis. Trende writes, “For an idea of how the Democrats are faring in swing states, the map below illustrates a rough average of the President’s approval in recent state polls. A dark red state has the President’s net approval rating at negative 10 or less, while a dark blue state is positive ten or more.” (Polls apparently weren’t available in eight mostly red states — such as Idaho, South Carolina, and South Dakota — which are depicted in white.)[img nocaption float=”left” width=”640″ height=”500″ render=”<%photoRenderType%>”]9897[/img]
Real journalism.Trusted by millions.
Unlimited access to in-depth reporting, expert analysis, and the stories that shape our country.
Already a member? Log in