Last week’s dismal report on plummeting April retail sales was no surprise for regular fans of economic data. After all, practically every other recent measure of economic life offers a similar picture. Employment growth (better described right now as decay) is in the basement, as is industrial production, capital spending, travel, and tourism. This leaves unanswered the big question: When will this coronavirus recession hit bottom and begin to generate meaningfully positive economic activity?
Accompanying the question is speculation regarding the shape of the recovery path. Will it be the V-shaped recovery we’ve all hoped for (an abrupt decline with an equally abrupt bounce back)? A slower U shape? A W, with a partial recovery followed by another decline? Or something resembling Nike’s famous “swoosh,” which is, after all, a U with a well-traveled bottom and very gradual climb back up to its original height?
To speak to the first question, let’s drill down and see what the public is doing with all the trillions of relief dollars that have been shipped out. This includes the “helicopter money” (the $1,200 per adult and $500 per child that has been sent out to a vast number of citizens), the Paycheck Protection Program dollars that have been provided by the Small Business Administration, and the enhanced unemployment benefit checks that are now making their way into the pockets of the more than 36 million workers who have lost their jobs. If that money is not being spent on retail sales, where is it all hiding?
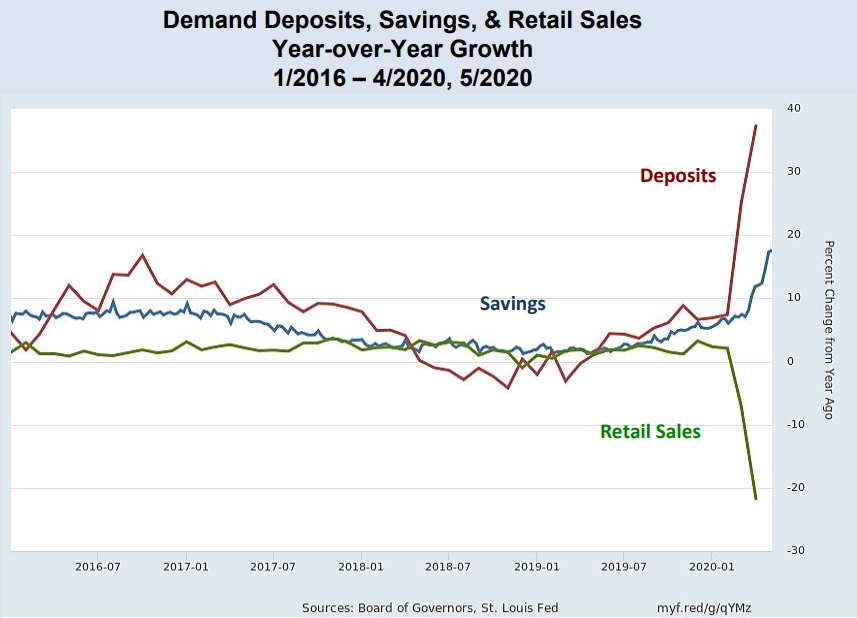
Part of the answer is shown in the nearby graph. It shows month-over-month growth in retail sales, money in checking accounts (demand deposits), and money placed in savings accounts. The data are surely not bashful. They show explosive growth in deposits (red) and savings (blue) — and plummeting retail sales (green).

Should we expect otherwise? After all, with money coming in while stay-at-home rules shutter retail stores, auto dealers, restaurants, and practically every other place where we normally spend money (including our churches, mosques, and synagogues), it’s no wonder that we have lakes of money sitting around with nowhere to go. After all, there’s only so much that Amazon can accommodate, and its deliveries are running a bit tardy.
So we know where the money has gone or at least a large part of it. When will it begin to flow to the economy, which is another way of asking about the shape of the recovery?
Unfortunately, there are no crisp charts and tables that put a spotlight on the answer to this question, but we can still speculate a bit. Part of the answer depends on the extent to which state economies fully open. We are just now beginning to see some results from the early openers, but we do not have sufficient data to say what the full-blown effects may be. But another part of the answer relates to all that money sitting in savings and checking accounts.
Economists, over the years, have developed theories to explain why people keep idle cash balances. Part of the explanation relates to interest rates. When investment returns are zero or almost negative, why go to the trouble to invest? Then there are our expected transactions that will require lots of money. If a large part of the public expects to pay college tuition in the fall, for example, we could expect to see a surge in cash balances. Finally, and perhaps the most meaningful piece of the puzzle, is the precautionary demand for money. People stuff more money in the mattress, as it were, when they are anxious about what may happen, when life is uncertain, and when lots of people are losing their jobs.
So as we look back at the chart showing savings, deposits, and retail sales, we have to think about the likelihood and timing of at least three separate developments: If all the states open for shopping and spending, whether or not there is a reversal of success in dealing with the coronavirus (affecting how many of us stay at home, voluntarily or otherwise), and if we see employment beginning to recover.
As I see it, those three “ifs” and “whens” translate into a U-shaped recovery, not the V so many of us initially hoped for, and significantly happier economic times long about the first part of 2022.
Bruce Yandle is a contributor to the Washington Examiner’s Beltway Confidential blog. He is a distinguished adjunct fellow with the Mercatus Center at George Mason University and dean emeritus of the Clemson University College of Business & Behavioral Science. He developed the “Bootleggers and Baptists” political model.

