Over the last few weeks, the Republicans have gotten a string of solid polls. Two recent polls have shown Republican Kevin Cramer leading of incumbent Senator Heidi Heitkamp by double digits in North Dakota. A whole mess of polls in New Jersey have shown that the incumbent Democratic Senator Bob Menendez is having much more trouble than a replacement-level Democrat would. And a recent YouGov poll showed Republican Rep. Marsha Blackburn with an eight point lead over former Democratic Gov. Phil Bredesen.
At the same time, Democrats have had a few of their own bright spots (e.g. Joe Manchin is maintaining a solid lead in West Virginia), and some non-polling factors (e.g. New Jersey’s general blue-ness in past elections) contradict what the polls are saying.
Recommended Stories


So I did a special run of SwingSeat, THE WEEKLY STANDARD’s Senate Forecast model on Sunday. I ran the official version of the model (which combines polls and non-polling factors like presidential approval, whether it’s a midterm, past results in the state, etc.) as well as a run that looks only at the polls.
The basic idea here is to give you a sense of 1) how good the polls are for the Republicans 2) how the fundamentals push on the polls and 3) what it means for strategy for both parties
We’ll start with a state by state look:
The Polls and the Fundamentals: a State-by-State View
I’ve collected the state-by-state results of both runs as well as the model’s topline probability estimate and compared them in this table:
| Contest | GOP Win Probability — Full Model | GOP Win Probability — Polls Only | Difference |
| Texas | 85.1 | 79.9 | 5.2 |
| Tennessee | 71.8 | 66.7 | 5.1 |
| West Virginia | 15.4 | 10.5 | 4.9 |
| Montana | 21.8 | 18.2 | 3.6 |
| Mississippi | 96.9 | 93.5 | 3.4 |
| California | 0 | 0 | 0 |
| Delaware | 0 | 0 | 0 |
| New York | 0 | 0 | 0 |
| Vermont | 0 | 0 | 0 |
| Wyoming | 99.9 | 99.9 | 0 |
| Mississippi Special | 94.2 | 94.2 | 0 |
| Hawaii | 0 | 0.1 | -0.1 |
| Maryland | 0 | 0.1 | -0.1 |
| Washington | 0.1 | 0.2 | -0.1 |
| Arizona | 31.9 | 32 | -0.1 |
| Utah | 99.3 | 99.4 | -0.1 |
| Nebraska | 96 | 96.3 | -0.3 |
| Connecticut | 0 | 0.4 | -0.4 |
| Massachusetts | 0 | 0.4 | -0.4 |
| Ohio | 3.2 | 3.8 | -0.6 |
| Michigan | 0.2 | 0.8 | -0.6 |
| Pennsylvania | 0.9 | 1.9 | -1 |
| Minnesota | 0.5 | 1.5 | -1 |
| Rhode Island | 0 | 1.1 | -1.1 |
| Maine | 0.1 | 1.4 | -1.3 |
| Wisconsin | 2.7 | 4.3 | -1.6 |
| Chamber Control | 75.74 | 77.6 | -1.86 |
| Virginia | 0.4 | 2.9 | -2.5 |
| New Mexico | 0.1 | 2.9 | -2.8 |
| Indiana | 29.7 | 33.4 | -3.7 |
| North Dakota | 87.2 | 94.5 | -7.3 |
| Nevada | 35.4 | 44 | -8.6 |
| Missouri | 44.8 | 55.6 | -10.8 |
| New Jersey | 1 | 12.7 | -11.7 |
| Minnesota Special | 5.4 | 17.4 | -12 |
| Florida | 18.8 | 42.5 | -23.7 |
The table shows the Republican candidate’s win probability in every state according to the full model (the one currently displayed on the site that uses polls along with other factors) and the older model (which almost exclusively uses polls).
In most states, the two versions of the model basically agree. But there are some important exceptions.
The fundamentals-plus-polls model is more favorable to Republicans than the polls-alone-model in Texas and Tennessee. The difference isn’t huge: Cruz and Blackburn, the Republican candidates, are favored no matter which output you look at. But the redness of Tennessee and Texas (plus Cruz’s incumbency in Texas) are enough to push the forecast a bit to the right despite Trump’s national unpopularity.
The fundamentals help Democrats in some other contests. In New Jersey and Minnesota’s special election, the polls have been reasonably close. But the full model gives a big bonus to incumbents in blue or purple-ish blue states. The model gives Nevada and Missouri a light tap leftward, but both states are competitive. And the model really likes Bill Nelson’s chances in Florida. Basically it still thinks that the race will shift to Nelson and end up looking more like other swing states where a Democratic incumbent is running in a swing state (e.g. Pennsylvania or Wisconsin, where the Democratic candidate is heavily favored) than, say, Missouri or Nevada.
Also, interestingly, the model pumps the brakes a little bit in North Dakota. Two recent polls have shown Cramer ahead of incumbent Heitkamp by double digits. The poll-based model loves numbers like that. But the fundamentals push the race a little to the left. It keeps Cramer as a solid favorite, but leaving a bit more room for a Heitkamp win.
What Does It Mean for Chamber Control?
Overall, as you can see in the table, both the older, polls-focused and newer, still-very-polls-focused-but-fancier model have Republicans in the driver’s seat. The official model gives the GOP a roughly 3-to-1 odds of holding the chamber, and the older model is just a few percentage points better for the Republicans.
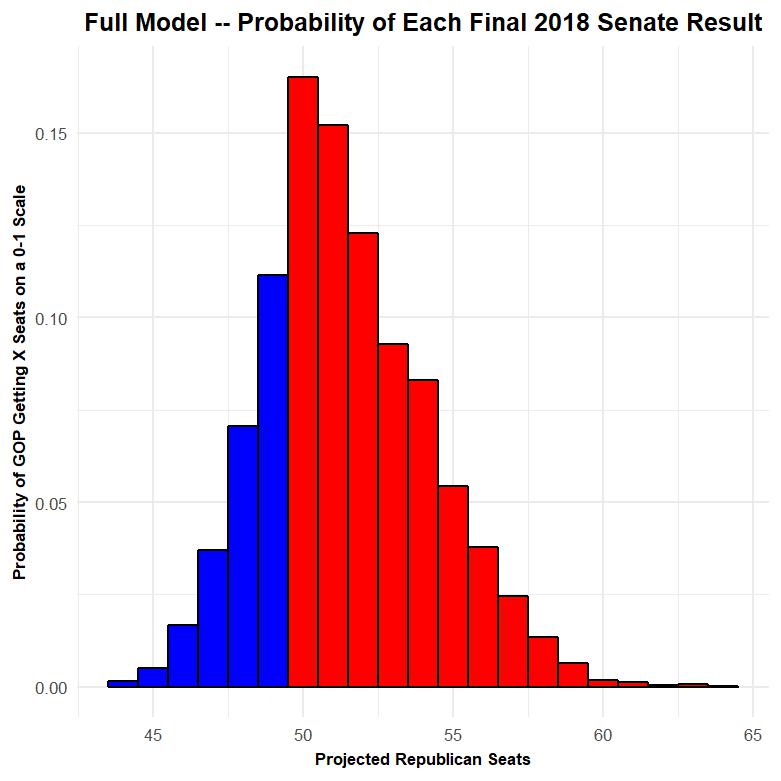
But if you dig a little deeper into the results, you can see some interesting, subtle differences. The polls suggest a slightly wider range of outcomes than the polls plus the fundamentals. To see this, take a look at the histogram for the full model
And compare it to the histogram for the polls-focused version:
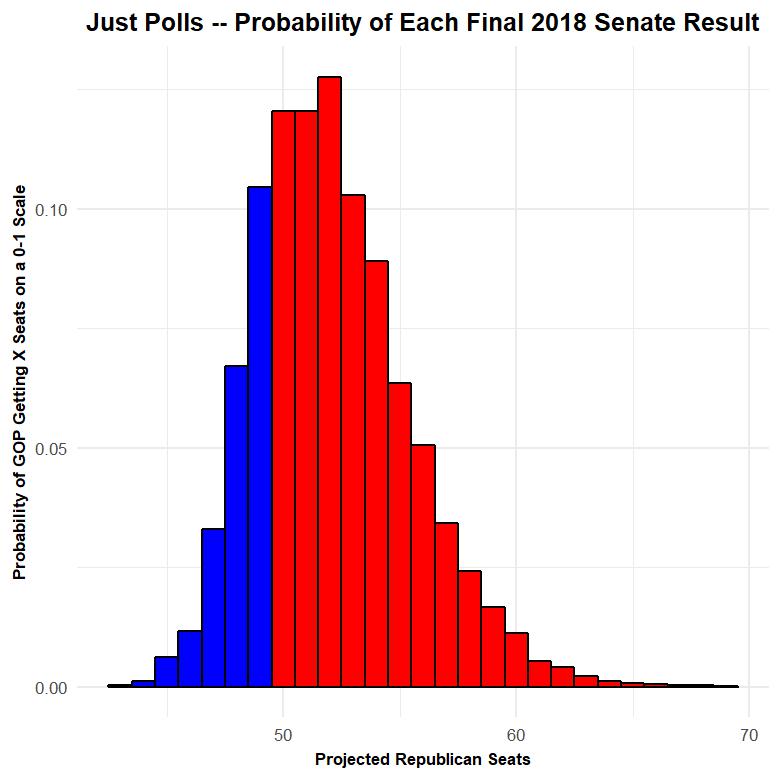
Histograms (also used in this piece) might initially look weird, but they’re actually simple. Each bar represents one outcome (e.g. the bar at 48 on the horizontal axis represents scenarios in which the GOP ends up with 48 seats post-election), and the height of the bar represents the likelihood of the scenario based on that model (expressed as a decimal probability between 0 and 1). The bars are colored intuitively—red bars mean that Republicans retain control of the Senate, blue bars are scenarios where Democrats take over.
A quick look at the histograms shows that both the polls-focused and the official model think that something around 51 to 52 seats is the most likely outcome. And both models think Republicans are the favorite—as evidenced by the larger amount of red than blue in both graphics. But there’s an interesting difference between the two plots—the poll-based model takes a bit longer to slope off to zero as the number of GOP seats gets higher. In other words, the model based almost exclusively on polls thinks that the playing field is big, and that the opportunities for GOP gains don’t stop with the red states (Indiana, Montana, West Virginia, North Dakota and Missouri) plus Florida—that New Jersey and the Minnesota special election could make it onto the board.
But neither model shows much more room to grow for Democrats. Both the full model and the poll-focused model think that it’s tough for Democrats to be competitive in any Republican race outside Texas, Tennessee, Arizona or Nevada.
In my view, there are two strategic consequences to this polls vs polls-plus-fundamentals difference:
First, if Republicans keep getting decent polls in states like New Jersey and Minnesota, they may be able to get Democrats to spend time and money in contests they shouldn’t have to worry about in this sort of a national environment. Republicans, because of their low exposure, probably won’t have that problem. Texas, Tennessee, Arizona, and Nevada are already on the board. Something funky could happen in the Mississippi special election, but generally it’s tough to imagine Democrats putting a new GOP state on the board at this point.
Second, we’re likely to see both parties try to force various states towards the fundamentals. I’d characterize some of Ted Cruz’s recent moves as attempts to activate Texas’s underlying redness. And I wouldn’t be surprised if we saw some Democratic efforts to make Scott vs. Nelson into Trump vs. Nelson in an effort to take advantage of the pro-Democratic national environment.