Since we launched SwingSeat, THE WEEKLY STANDARD’s stats-powered Senate forecast, I’ve been periodically writing “SwingSeat Update” pieces to explain why the model is coming up with the predictions it’s coming up with.
But today, I want to give readers a more detailed sense of the spread of plausible outcomes and get a handle on some of the unlikely-but-not-quite-worst-case-scenarios for both parties. The basic goal here is to emphasize the uncertainty of the forecast and show readers that they need to be looking at the error around every forecast, not just the most likely outcome.
Recommended Stories


The Spread: The Different Outcomes SwingSeat Dreams Up
Every night, I feed SwingSeat a bunch of new data. The model eats that data, dreams up thousands of plausible scenarios and distills those scenarios into the projections you see on the main page. So I decided to stop the model between those last two steps and dig more deeply into the scenarios. The most straightforward way to visualize the spread is via a histogram:
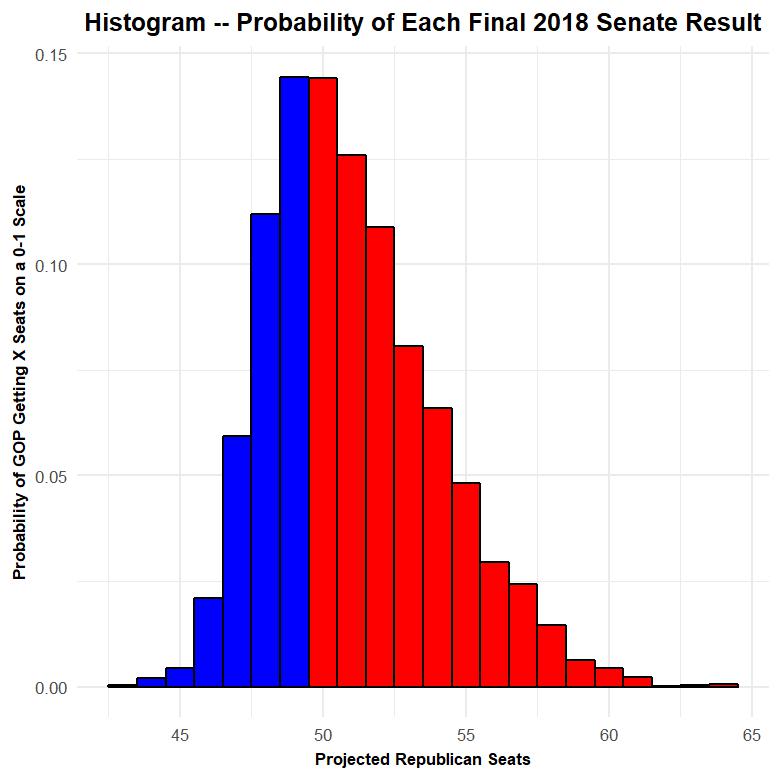
This is a histogram. It shows how frequently SwingSeat thinks different scenarios will happen. For example, it thinks that Republicans will win 50 seats 14 percent of the time, so the bar that’s at the 50 seat mark on the horizontal axis rises a height of .14 on the vertical axis. Basically, the taller the bar, the more likely the Republicans are hold that number of seats after the 2018 elections.
There’s an unsubtle message to this histogram—Republicans are favored to hold the Senate. There’s just more red on this graphic than blue, and that’s because Republicans win in something close to two-thirds of the scenarios SwingSeat imagined Wednesday (note that the values here represent the model’s state as of the morning of September 26).
But the histogram is also designed to show the details of the distribution. If you look at the red bars and sort of trace them as they go right, you’ll notice that it takes a while for the height of the bars to taper off to zero. But if you look at the blue bars as they head left, you’ll notice a steep drop-off at around 47 Republican (53 Democratic) seats.
The graphic then suggests that Republicans could realistically end up with a seat count in the mid-to-high 40s, the mid-to-high 50s or (most likely) somewhere in the middle. And the model tells us exactly how we could get to either result.
The 90th Percentile: Democrats
Imagine that, between now and Election Day, Democrats generally gain in the polls in various races. Maybe that’s a result of uniform movement or maybe it’s a combination of damaging statements by different candidates in different states. (Which can happen: Remember Richard Mourdock’s and Todd Akin’s almost coordinated face-plants in 2012?) And on top of that, imagine that the polls underestimate Democrats. In other words, imagine that most things that could go wrong for the GOP do go wrong, but that circumstances could still count as normal (e.g., Mueller doesn’t come back with something damning about Trump, which would scramble the numbers on everything).
I tried to get the model to do something like that by looking for the simulation that was more Democratic than 90 percent of other simulations. The idea here is to find a scenario that’s unlikely (something like 1 in 10 odds) but was more plausible than a 1-in-100 ,or 1-in-5000, shot. In this great-for-Democrats-but-not-unthinkable scenario, Republicans get just 48 seats.
And we can use the model to sketch out the path to 48 Republican seats. In scenarios where Democrats get 52 seats, they typically defend all their seats (including the red states with Democratic senators), take Arizona and Nevada and then grab Tennessee. In some simulations they take Texas but lose some other state. And, if you look at the histogram, scenarios where Democrats take all four competitive Republican-held seats (Texas, Arizona, Nevada, and Tennessee) and end up with 53 seats is thinkable, but somewhat more difficult.
Basically, the model suggests that the not-quite-best-case-but-close-to-it scenario for Democrats is to get 52 or 53 seats. It’s technically possible for them to get to 54 seats, but that would involve an upset in Mississippi or maybe Nebraska plus everything else going right. But the probability of something like that happening is about 2 percent, according to the model.
The 90th Percentile: Republicans
Now imagine the opposite scenario—the almost-but-not-quiet-best-case for the GOP. Imagine that Trump’s approval increases, Democrats in key races stumble, that the polls underestimate Republicans and that the underlying partisanship of some of these red states with Democratic senators reasserts itself. Basically, imagine that everything goes right for the Republicans, but that nothing extraordinarily good happens for them.
In this great-for-Republicans-but-not-unthinkable scenario (the scenario that’s better than 90 percent of the others for the GOP), Republicans get 55 seats. And, interestingly, the model doesn’t have one opinion on what a 55-seat GOP margin would look like.
In basically every case where the GOP gets 55 seats, the party defends the safe red states, Texas and Tennessee, and then takes North Dakota. That gets the GOP to 50 seats. The other five seats usually come from a combination of Nevada, Missouri, Florida, Indiana, Arizona, Montana, and West Virginia. The model thinks that Missouri and Nevada are the easiest pickups of the bunch, that Indiana and Florida are a notch tougher and that West Virginia and Montana are a bit more difficult to pick up than the others. And, interestingly, these 55 GOP seat scenarios occasionally involve Republicans grabbing an unexpected win in Wisconsin or Minnesota’s special election.
This great-but-not-impossible scenario for the GOP basically involves coming close to running the table on currently competitive races but not quite making it there. And, as the histogram shows, there’s a small but real chance of the GOP gaining more than that by hitting more of their targets or sneaking by in a contest that looks Democratic now (e.g., Minnesota’s special election or Wisconsin). In that case, the Republicans would make it out of the midterms in much better shape than they started, despite running under an unpopular Republican president.
The 2020 Map: Both Parties Need Padding Now
These edge scenarios matter because they have both policy and downstream political consequences. The policy consequences are obvious (the Senate is an important part of policy on numerous issues, like, say, Supreme Court nominations). And the downstream political consequences are real, because the party that loses in 2018 isn’t guaranteed to bounce back in 2020.
The 2020 Senate Map is probably a bit worse for Republicans than Democrats on balance (my former colleague Sean Trende makes the case well here), but it’s not as imbalanced as the 2018 map. Republicans will have to defend 22 seats (they had a very successful 2014 midterms, and those seats are up again), but a lot of them are in safe states. They could have problems in Maine, Colorado, Iowa, North Carolina, and potentially Arizona. Democrats will have to defend deep red Alabama (where Doug Jones is finishing Jeff Sessions’ term) as well as swing states like New Hampshire, Minnesota, Michigan, Minnesota and Virginia.
The 2016 GOP knew that the 2018 Senate Map, no matter who was president, would be good for them. But neither party has the same assurance about 2020. If either party comes out with a thin margin in the senate (which is what SwingSeat currently projects as the most likely outcome), they’re going to have to start 2019 by worrying about how much longer than can hold the chamber.