
For the last month or so, there’s been a sort of rough consensus about the battle for control of the House: Democrats need to be ahead by about 7 points on the generic ballot in order to have a 50-50 shot at taking the House. Some analysts and elections watchers might put the bar a bit higher or lower, but I think most would say that that’s a reasonable estimate.
But someone who doesn’t run these numbers for a living might ask—Where does that 7 points idea come from?
Recommended Stories


It’s a reasonable question. And while I’m not sure how other elections analysts have come up with their estimates, I thought it might be useful to run through some simple, easy-to-explain, ballpark methods that suggest that seven is a pretty good rough estimate for where the breakeven point on control of the House.
Partisan Lean Plus Incumbency
The easiest way to get a handle on the breakeven point is to line the districts up from easiest GOP win to toughest and see what’s in the middle. The basic idea is that if Republicans can hold the 218th most vulnerable seat, there’s a good shot they can hold the other 217 seats that are more Republican and thus keep their majority. And since the House map favors the GOP (geography, gerrymandering, and the presence of incumbents helps them), we should expect this 218th seat to lean Republican.
And when I looked at past presidential results (with a bonus for incumbents of both parties) that’s exactly what I found. The 218th seat was about 6.4 percentage points more Republican than the country at large (this number is in terms of margin, not vote share). So if Democrats have a roughly 7 point advantage in the generic ballot, it’s not hard to imagine them taking those marginal seats in the middle of the election map and ending up in a close race.
Now remember, this is just back-of-the-envelope math. The incumbency bonus is an estimate based on a regression analysis of 2014 election results (I used only the most recent midterm since the incumbency advantage has diminished over time), but not all incumbents are going to run equally well. Moreover, I used Trump as the baseline since he was the most recent presidential candidate. But it’s possible that Romney, not Trump, will end up being the right baseline. And maybe most importantly, this math assumes that if Democrats lead by seven in the generic ballot polling, they’ll do about seven points better than they would in a neutral environment more or less everywhere. That’s a big assumption.
But back-of-the-envelope math isn’t supposed to be exact—it’s a ballpark estimate. And that ballpark supports the idea that a 7-ish point Democratic lead would make for a close race for control of the lower chamber.
Win Rates
We can also take a less direct, slightly more sophisticated approach using win rates. The basic intuition is to look at a recent election where Democrats took the House (e.g. 2006), calculate win rates for various types of districts (e.g. how many slightly right leaning districts Democrats win? How many very blue districts? etc), and apply those win rates to the current map. I used this method in a previous piece—read more here.
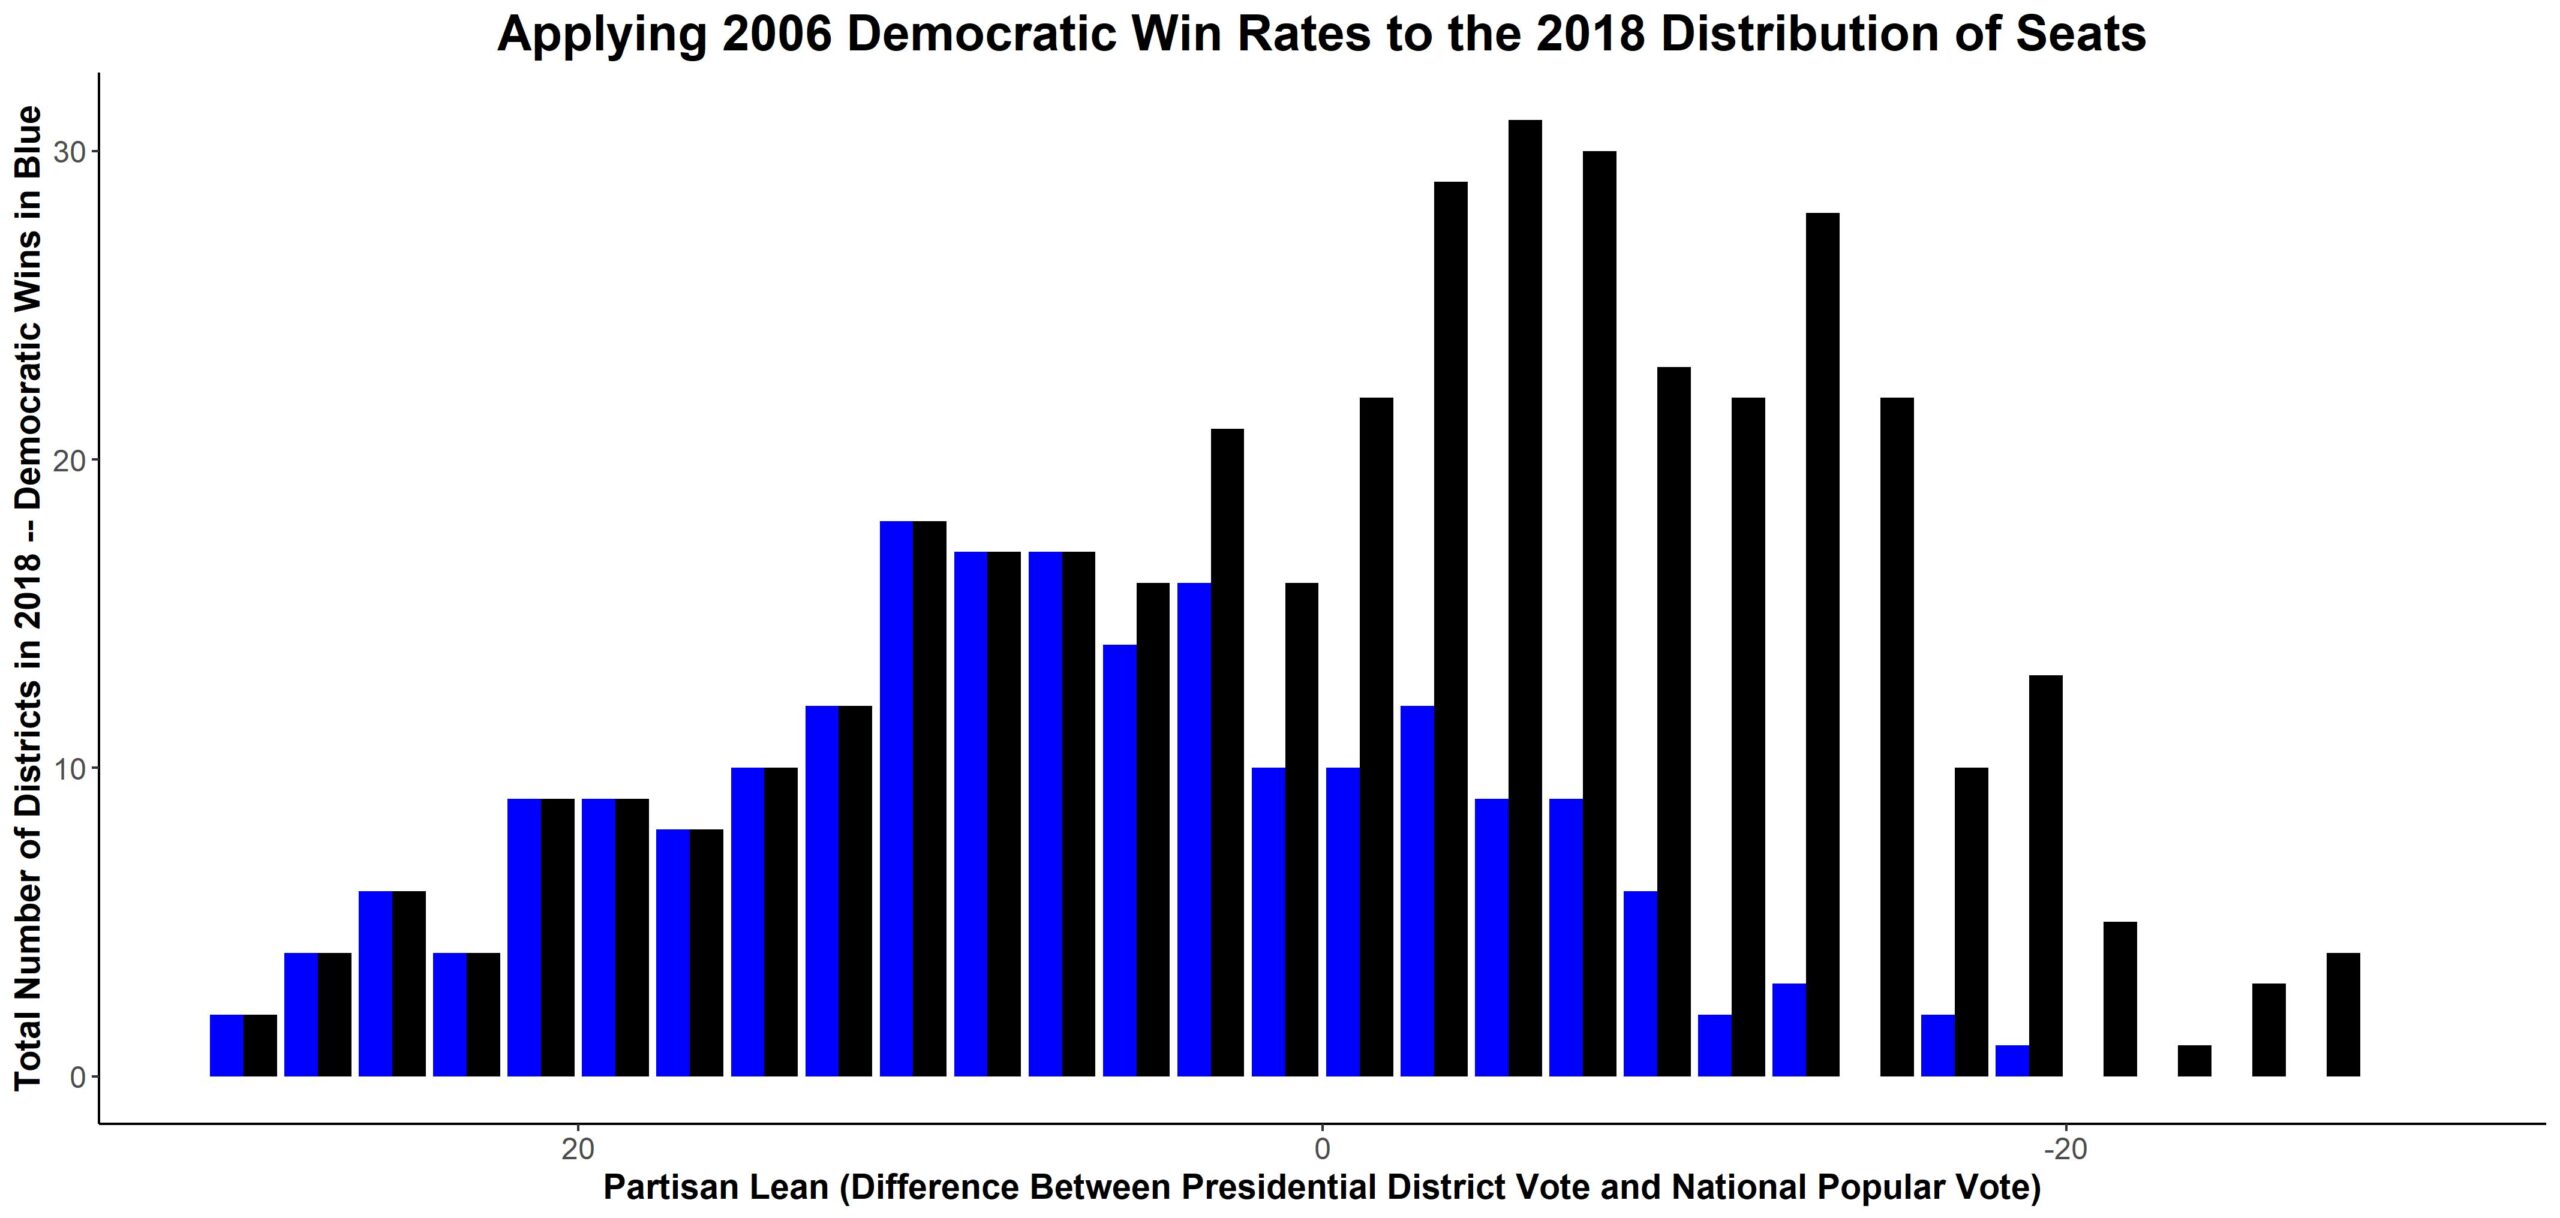
This visual shows the rate of Democratic wins in 2006 applied to the current House landscape. Each black bar represents the number of districts with a certain partisan lean (increasingly Democratic districts are on the left hand side) and each blue bar represents the number of districts Democrats would win if they equaled their 2006 success rate. In that year, Democrats managed to win the House majority by taking the swing districts, reaching into GOP territory and keeping a few ancestrally Democratic, far right districts in the fold. If you apply these numbers to the 2018 map, you get a Democratic majority of 230 seats.
It’s possible that this method overestimates the number of seats Democrats could win—back in 2006, Democrats still held onto a solid number of ancestrally Democratic seats that voted for GOP presidential candidates by wide margins. If you rule out the possibility of Democrats winning any seat that leans Republicans by 10 points or more (that number is in terms of two-party vote share, not margin), Democrats still win 222 seats and get a bare majority.
Either way, this suggests that a repeat of the 2006 election would get Democrats close to a majority this year. In 2006, the RCP average had Democrats ahead of Republicans by 11.5 points in the generic ballot heading into the election, but they ended up winning the House popular vote by 8 points. The generic ballot doesn’t perfectly correspond to the House popular vote (e.g. in some cases a Republican or Democrat will run unopposed and generic ballot polls typically don’t take that into account). But if Republicans were to be trailing in the generic ballot by 7 on Election Day, an 8 point Democratic House popular vote win wouldn’t be surprising.
Regression Analysis
I also put together a simple regression model that used district-specific information (like presidential results adjusted for popular vote totals), incumbency, the previous House election result in that district (adjusted for House popular vote), and the national two-party popular vote share to predict district-by-district results from 2006 to 2016. The original data was collected by political scientist Gary Jacobson and Daily Kos Elections.
The model was far from perfect. Some of the statistics that are often used to assess models (coefficient of determination, standard error of the estimate) looked decent, but the model often underestimated the number of total seats the winning party took when I ran it on past data. It’s not as accurate as a full scale model that integrates more district-by-district polling, fundraising, and other important measures. But again, if gives you a pretty good ballpark estimate.
So I plugged in the 2018 data with a 7 point Democratic advantage in the House popular vote and the model said Democrats would win 214 seats—four short of what they need to retake the majority. The margin of error here is big, but that’s still close to a 50/50 toss-up.
The Elephant In The Room: Error
So are Republicans guaranteed to lose the House if Democrats win the overall vote by 7 points?
Nope.
Each of these methods (partisan lean, win rates, regression) involves error and none of them can take in all the details that will end up shaping the actual vote. Every district has a different set of candidates, a history beyond what happened in 2016, a changing demographic mix, and lots of other district-specific variables that can’t be captured in polling.
Trying to translate a national number like generic ballot into 435 different races is hard—it’s why we don’t only rely on a national number in presidential elections (where we have swing state polls) or Senate races (where there are race-specific polls). It’s also part of the reason it’s worth looking at race-by-race handicapping alongside quantitative models of the outcome. And there’s room for disagreement on exactly what probability a 7-point margin translates into.
Democrats still have an edge in the overall race for House control, but the range of outcomes is wide. It’s possible to imagine scenarios where the GOP keeps the generic ballot somewhere in the danger zone, takes some losses (as the president’s party almost always does in a midterm) and holds the majority. It’s also possible to imagine the generic ballot starting to more closely reflect the results from special elections and more clearly signaling a wave.
I know this isn’t a particularly satisfying answer, but I think it’s the right one. Democrats have a real edge, but there’s still suspense about what will happen in November.