

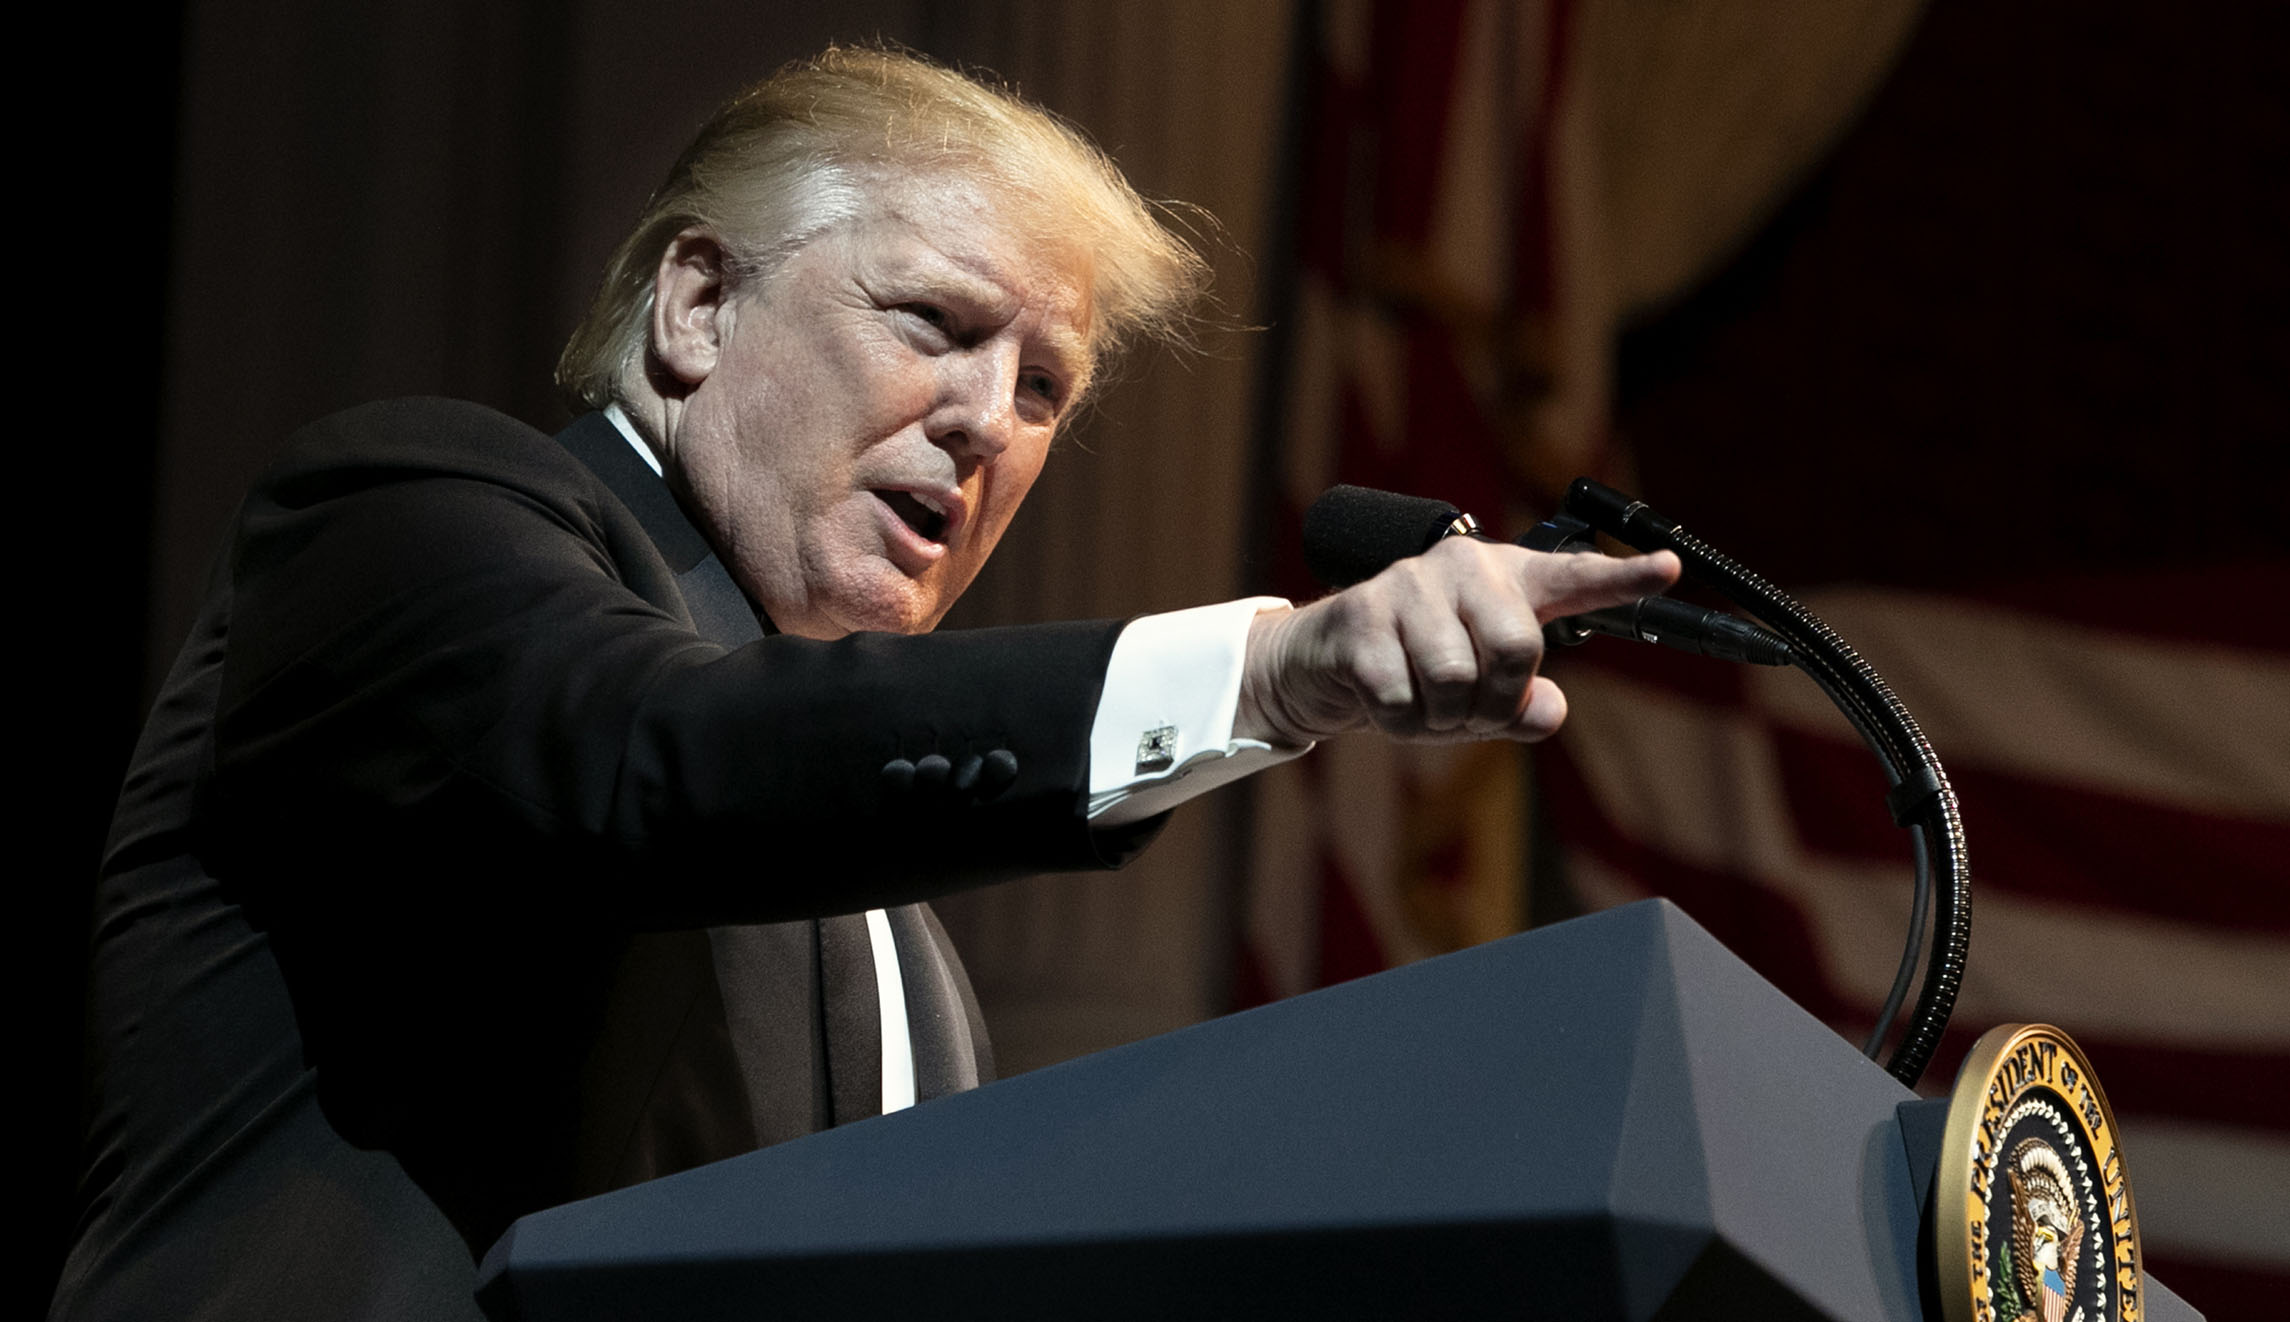
In an ironic turn of events, the day after President Trump shocked the world with his plan to impose border taxes on all imports from Mexico beginning June 10, the Federal Reserve Bank of Philadelphia released its latest 50-state “leading indicators” map, which forecasts a data-driven look at state economies six months in the future. The “Tariff Man,” as the president has styled himself, is once again living up to the moniker.
I provide here the latest Fed-produced map, along with its April 2018 counterpart for comparison purposes. The April 2019 map forecasts state economic conditions for October 2019, about four months before the Iowa presidential caucuses.
Stay informed.Stay ahead.
Join Washington Examiner for unlimited access to the news, analysis, and commentary that matter most.
Already a member? Log in
