In less than two months, the 2018 election will head straight into Trump-land: the southern suburbs of Pittsburgh. Last October, Republican Rep. Tim Murphy resigned (he was facing ethics issues regarding his treatment of employees and had encouraged his mistress to get an abortion—not a great look for a pro-life congressman), leaving his seat vacant. And on March 13, voters in Pennsylvania’s 18th Congressional District will choose a new congressman: either Republican Rick Saccone or Democrat Conor Lamb.
So far, this race hasn’t garnered much attention outside the wonkiest parts of the political world, but it might start attracting more attention soon. President Trump visited the 18th district last week, and Democrats have been pumping a poll showing a tight race there. With that in mind, I put together this short explainer on the race, covering the data on the district, which candidate is currently favored to win, and how to interpret the eventual results.
So what is there to know about PA-18?
Pennsylvania’s 18th Congressional District is in the southwestern part of the state, and it includes parts of Pittsburgh’s southern suburbs as well as some rural areas.
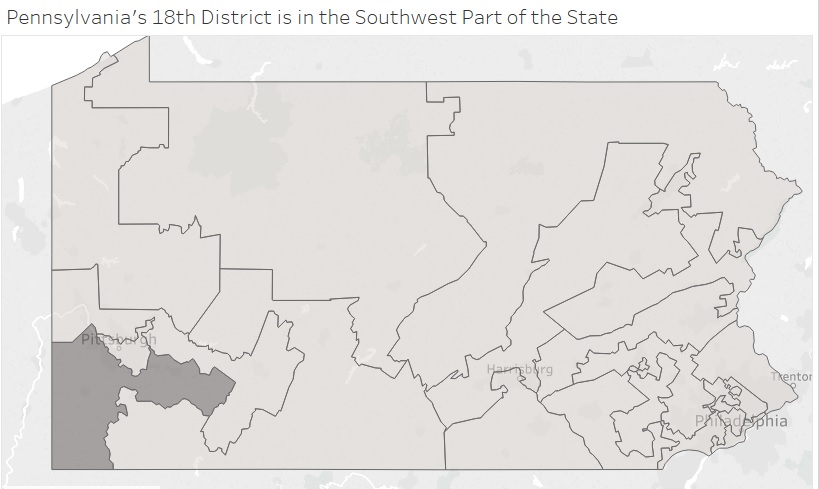
Pittsburgh is, politically speaking, an interesting place. It’s the only true major city in Appalachia, and, unlike many other major metro areas, it has been trending right for the past few decades. In 1988, the Pittsburgh metro area gave Michael Dukakis 60 percent of the two-party vote, and in 2016 it gave Hillary Clinton 47 percent. The 18th covers some of the red-trending parts of the area.
The .gif above shows this rightward trend on the municipal level from 2000 to 2016 in and around Pittsburgh (I animated maps created by DDHQ’s excellent mapmaker, J. Miles Coleman). Over time, Democrats have been able to hold onto the central part of Pittsburgh, but started to lose their grip on some of the outlying areas and parts of the 18th district long before the GOP nominated Donald Trump. In 2016, the 18th district voted for Trump by a 20-point margin, according to Daily Kos Elections—not so far off some of the House districts that held special elections in 2017 (e.g. Trump won Montana by a 20-point margin and South Carolina’s 5th Congressional District by a 19-point margin).
The 18th district is also demographically similar to some of the other districts that have already held special elections.
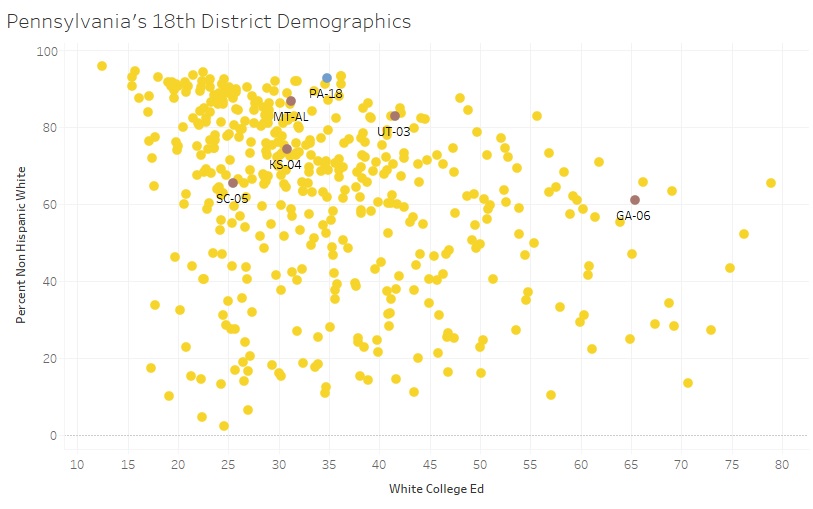
These numbers are five-year estimates from the 2016 American Community Survey (part of the Census), and they show the percentage of residents that are non-Hispanic white and the percentage of non-Hispanic white adults age 25 and older that have college degrees. The races where competitive special elections occurred (The California 34th is excluded because two Democrats made the runoff) are highlighted.
The message of the graphic is simple. Pennsylvania’s 18th Congressional District is significantly whiter than some of the other House districts where special elections have been held, but the white voters of PA-18 aren’t much more or less well-educated than those in Montana, the South Carolina 5th, The Kansas 4th, or the Utah 3rd. Some of the biggest differences between these districts are likely to be cultural—that is, there are real differences in how Republicans (and Democrats) in a western state like Montana, a heavily Mormon state like Utah, an ancestrally Democratic state like South Carolina, and southwestern Pennsylvanians think about politics.
When you put all of these details together, you start to see a clear picture of what this district is like. It’s a very white district in an area that’s been trending Republican for a while. It doesn’t have the same level of college-educated voters as Georgia’s 6th District, and the political culture there is different from some other districts that have held special elections so far. But it still leans hard to the right, and we can use some of the data from past special elections this cycle to get a sense of how things might turn out in March.
Is PA-18 going to flip?
As of now, the race leans Republican, but the GOP doesn’t have this race in the bag.
The polls currently show a lead for Republican Rick Saccone. A January Gravis poll showed Saccone leading Conor Lamb, the Democrat, by 12 points, and a more recent poll by DFM Research (a Democratic firm) showed Saccone with a three-point lead. Historically, House polls haven’t been as accurate as Senate or presidential polls, but it’s basically always better to have a lead in the polls than to be behind.
If Saccone underperforms Trump—the average Republican running in special elections since inauguration has—he could still hold his seat.
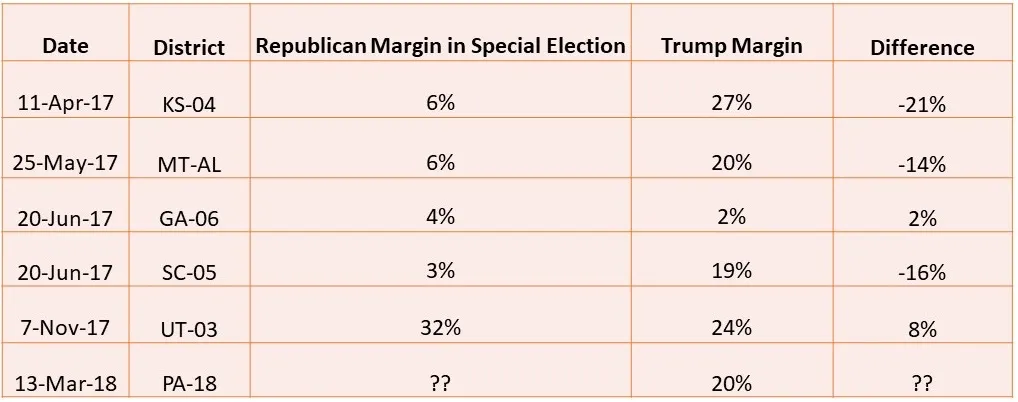
This table shows the results of special House elections with two major party candidates (again, CA-34 is excluded) since Trump took office. Republicans in Kansas’s 4th Congressional District, South Carolina’s 5th Congressional District, and Montana’s At-Large District underperformed Trump. Republican John Curtis outperformed Trump in Utah’s 3rd Congressional District, but in Utah that’s not a very high bar. Mitt Romney and George W. Bush (both who seemed to be more popular than Trump with Mormon voters) earned 78.3 and 67.5 percent of the vote in UT-03 – significantly better than Curtis’s 58 percent. Republicans fared better in the Georgia 6th, but the average of these results is a Republican underperformance.
In other words, Saccone could underperform Trump by about as much as Greg Gianforte in Montana or Ralph Norman in South Carolina’s 5th while still winning the seat. Moreover, the average Republican state legislative or House special election candidate underperformed Trump’s margin by 11 points. That level of underperformance would still allow Saccone to win.
That being said, Saccone isn’t completely safe. The average might be 11 points, but results in individual races vary wildly.
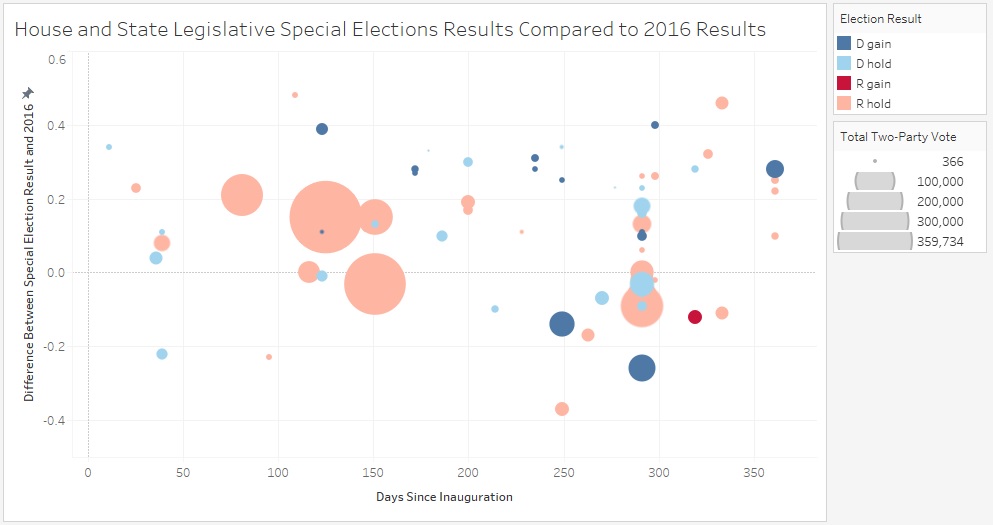
This visual (originally made for this piece) shows the results of special elections since Trump’s inauguration. Each point is an election. The graph reads left to right (later elections are further to the left), and the vertical position shows which party outperformed their 2016 showing and by how much. Higher points indicate a bigger Democratic over-performance, and lower points show a greater Republican over-performance. The color indicates which party won: Pink is a Republican hold, dark blue is Democratic hold. And the size of each circle is proportional to the number of votes the major party candidates received.
There’s a lot of data packed into this visual, but the point is to show that since inauguration, the results of individual elections vary a lot. The average result is an 11-point over-performance by Democrats, but that average includes significant Republican over-performances and Democratic over-performances that, if replicated, would allow Lamb to win.
In other words, the race leans Republican but isn’t a sure thing. Sabato’s Crystal Ball and the Cook Political Report both rate the race as “Leans Republican,” and Inside Eletctions says the race is “Likely Republican.” Neither party should ignore the race, but Saccone is favored.
We can learn from this result even if the state doesn’t flip
Whether or not the seat flips, this race will provide another useful data point for figuring out exactly what the political climate will look like in November 2018. If a party outperforms their baseline in special elections on average, they tend to do better in the House popular vote—and this election will give us another number to feed into that average. Moreover, this election will take place in a different region than others, possibly giving some early information on whether Republicans in well-educated suburbs (Georgia’s 6th district), western states (Montana and Kansas’s 4th district), the ancestrally Democratic south (South Carolina’s 5th district), and Appalachia respond differently to Republican candidates in the Trump era.