If you’ve read any election coverage in the last 12 months, you probably know that college-educated voters don’t like President Trump. In the 2016 election, Trump made significant gains with non-college-educated white voters but lost a significant number of traditionally Republican, affluent, college-educated voters. In 2017, special and off-year election results have suggested that voters in this latter group are continuing to turn out and register their dissatisfaction with Trump by voting for Democrats. And if Democrats manage to retake the House in 2018 (an event that has, in my view, better than 50-50 odds but is far from a certainty), well-educated whites will probably be part of the story.
But if 2018 follows the patterns of other recent wave elections, they might not be the whole story. Specifically, in recent wave elections, the winning party hasn’t been confined to districts that fit just one demographic profile. This matters for both parties: Republicans will do better in the midterms if they think broadly about which seats they need to defend, and Democrats will likely perform better if they keep an open mind about which seats they should target. I’ll use data from 2010, 2008, and 2006 to explain.
Recommended Stories


In wave elections, the winning party often wins in a variety of districts. As David Shor points out, the Republican wave of 2010 hit a wide variety of districts—suburban, rural, northern, southern and more. Shor’s description of 2010 also applies to 2006, a wave year when Democrats gained in a variety of districts.
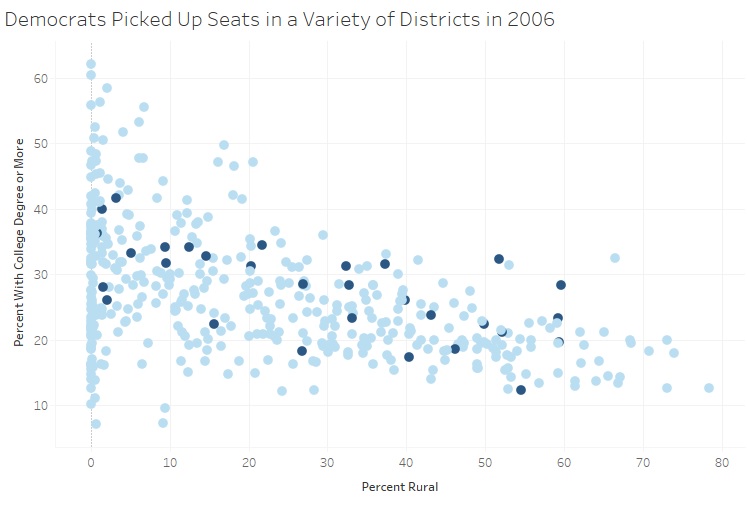
Each point in this graphic is a district, and the vertical and horizontal position indicate how well-educated and how rural each district was according to the Census. The dark points are the seats that went from Republican to Democratic control in 2006.
There’s no clear pattern in this graphic—meaning Democratic gains weren’t confined to one type of district. Some Democrats won in more rural areas, and others won in more urbanized districts. Some Democrats won in areas with a lot of college graduates, some won in areas without many. A similar non-pattern shows up when you map the 2006 House elections.
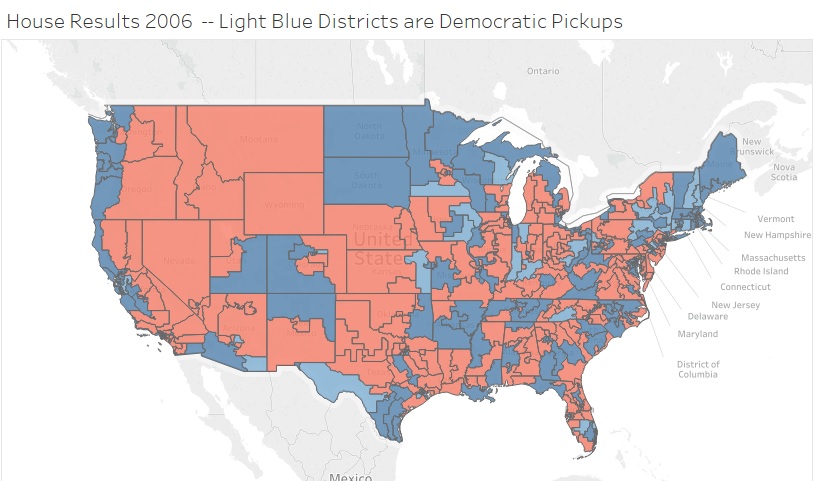
Democrats made gains in every major region—the South, the Northeast, the Midwest, and the West. Obviously they made more gains in some regions than others. The blue team picked up about as many seats from Pennsylvania and New Hampshire as they did in whole South. And a more detailed analysis would likely show that some demographic groups shifted more than others between 2004 and 2006 and that incumbency mattered more in previous elections than it does today. But the point is that recent waves haven’t been strictly confined to one part of the country or one demographic group. Instead, they’ve allowed both Democrats and Republicans to grab numerous districts that lean slightly towards the other party.
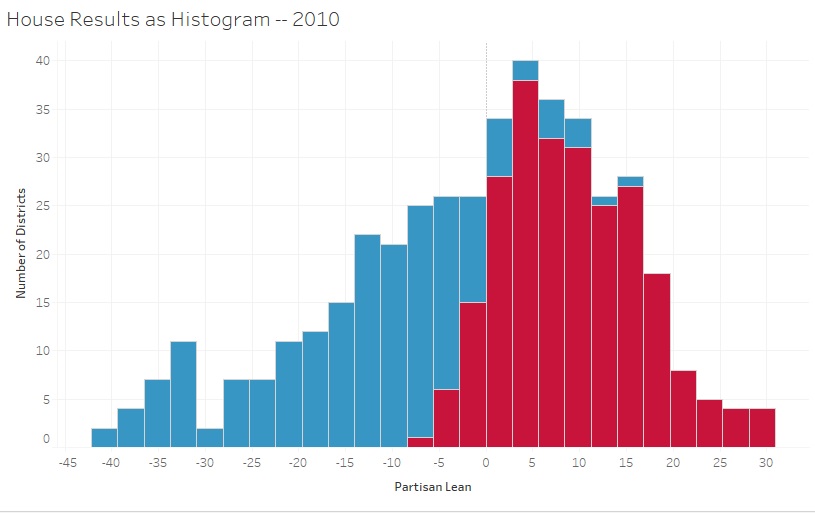
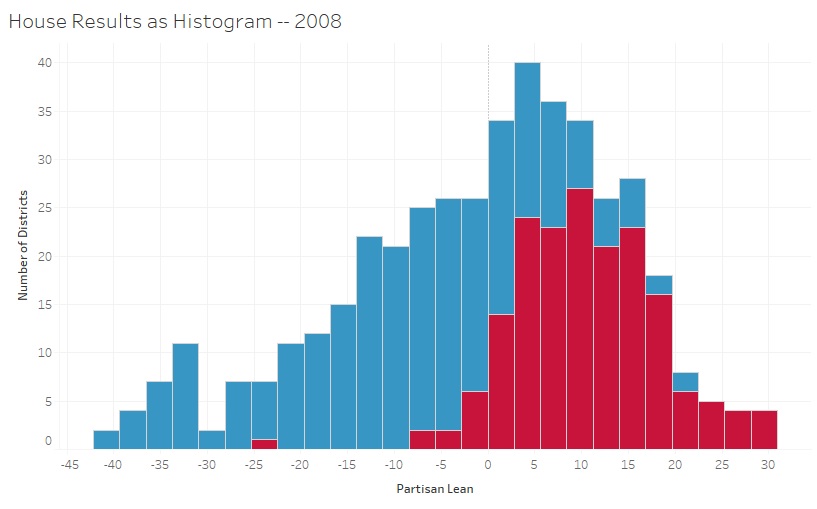
This graphic shows that after the 2010 wave, Republicans mostly held seats that leaned toward Republican presidential candidates (data from the previous two elections was used and the two-party share of the popular vote was subtracted out to control for national conditions) while gaining a few seats that were somewhat to the left of the country. It’s called a histogram, and it basically divides seats up into categories and shows how many seats are in each category. For example, not many seats were 40 or more points more Democratic than the country as a whole, so on the far left side of the graphic (you can see where 40 is on the horizontal axis) the bars aren’t very tall. Yet there are quite a few districts that lean just a couple points further to the right than the country, so there are some tall bars in the center-right portion of the graphic. Red bars represent districts that Republicans held and blue bars represent Democratically-held districts.
In other words, Republicans held almost all the districts that leaned toward their party in previous presidential elections while making significant gains in center-left districts.
In 2008, a similar basic pattern appears in a more muted way. Some incumbent Democrats with strong personal brands managed to win in areas where then-Senator Barack Obama performed poorly. But the influence of national politics is real, and Democrats won almost all of their safe districts while taking a bite out of the center-to-middle right part of the distribution.
The pattern in 2006 is a little more complicated (more details on that can be found here), but the basic point is that some of the 2018 battleground districts will be exactly where you might expect them to be given the 2016 election results and current national environment.
Obviously it’s too early to know with certainty whether Democrats will take the House and exactly what the shape of their coalition would be. But it’s not hard to imagine a combination of factors helping the Democrats. They may continue to make gains in areas with college-educated white voters. It’s also possible that rural, non-college educated white voters will fail to show up (there’s evidence that happened in the Alabama special senate election, the Virginia gubernatorial race as well as some other races). As Dave Wasserman notes, this poses a serious threat to Republicans, as higher college-educated white turnout and lower turnout among non-college educated whites could work together to shift the overall electorate left. Moreover, it’s possible that turnout among racial minorities will look better for Democrats in 2018 than it did in 2014 or 2010. It’s unclear exactly what those turnout numbers will look like—African-American turnout seemed to be stronger in Alabama than Virginia—but it’s possible that higher turnout among these groups could shift the map.
The basic lesson in these numbers is the same as the basic lesson of the 2017 elections. Republicans should nominate solid candidates, try to keep strong incumbents in place and be prepared to defend some districts that are typically too red for Democrats to take. Nominating a bad candidate (e.g., Roy Moore) can lead to losing a race that a more generic Republican could have won, and incumbents tend to perform better than non-incumbents. Additionally, races that fly under the radar (like Kansas’s 4th District special election or South Carolina’s 5th District) sometimes end up too close for comfort. Democrats should try to nominate good candidates (e.g. Doug Jones, Archie Parnell) and not be too narrow-minded about which districts might become competitive.