Everyone who has ever publicly released an election forecast has gotten pushback from readers. Honestly, it’s not a bad part of the job. We have a good forecast, so it’s fun to use that opportunity to explain our methodology, its strengths and weaknesses, its past accuracy, the uncertainty and why the projections look the way they do. And frankly I enjoy talking to the type of people who spend their limited free time digging into elections forecasts and asking good questions.
Most of the time I just answer those questions on Twitter, but I’ve gotten one piece of feedback that deserves some special attention: that the forecast seems to be contradicting itself.
The question runs something like this: if you look at the model’s state-by-state projections and give the Republicans every state where they’re favored while giving Democrats every state where they’re favored, Republicans end up with 50 seats post-election. At the same time, the model’s official projection is that Republicans will end up with 51 seats (or 51.6 seats if you like looking at the average simulation instead of the median).
So what’s going on? Does the model think Republicans are going to win 50 or 51 seats?
The best way to get your head around this is to look at a special kind of map—I don’t know if it has an official name, but I call it a “Conditional Map.”
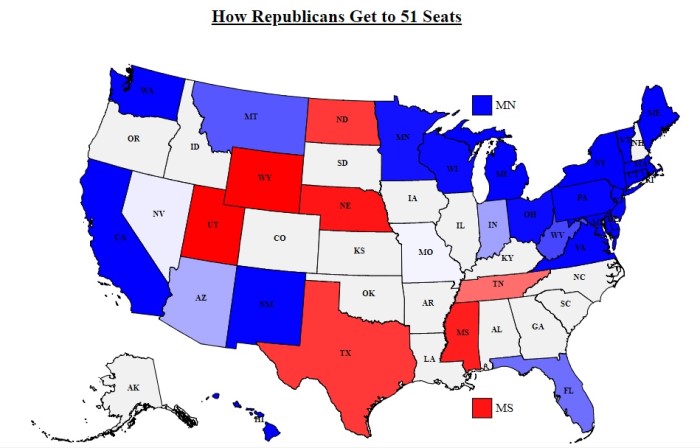
This map is different from some of the other election maps you’ve seen. The best way to think about it is as the model’s roadmap of how the GOP gets to 51 seats. To make it, I grabbed all the simulations where the GOP got 51 seats, then figured out how often they won each state in those simulations. So if a state is very red (like Texas or North Dakota) that means the vast majority of paths to 51 Republican seats involve winning that state. On the other hand, if a state is very blue (like New York) then the GOP path to 51 seats basically never includes a win there (note that Nevada and Missouri are a very light shade of blue).
This 50 seats vs 51 seats paradox is on full display here—if Republicans win all the states that are colored some shade of red they’ll get 50 seats, but we know that this is a map of scenarios where they get 51 seats.
And best way to resolve this paradox is by realizing that the model expects Republicans to score an upset somewhere, but it’s not sure where. Democrats are favored to win Arizona, Nevada, Indiana, Florida, etc., but they’re not favored to win all of them. So in one simulation, the GOP might get to 51 by adding Missouri to Texas, Tennessee, North Dakota and the safe red states. But in another scenario, they add Nevada or Indiana to their wins instead of Missouri.
If that’s still unclear, just think back to the last time you played a board game that involved dice. There are a lot of board games where something great happens when you roll a six (or maybe something super annoying happens when you roll a one) on a six-sided die. Every time you roll the die, you know that the odds are against you rolling a six. At the same time, you’d be surprised if you played the whole game and didn’t roll at least one six.
What’s happening in the model isn’t exactly like what happens with dice rolls (you can read more about the probability estimates and how they’re generated here), but the basic analogy is still helpful. Democrats are favored (even if the advantage is truly tiny in some races) in every competitive race outside Texas, North Dakota and Tennessee—but they’re not favored to win all of them. Others have compared the situation to whack-a-mole: Democrats are trying to take the chamber by covering all of their possible weak points, but that’s tough to do when close races keep popping up.
Readers have raised other questions about the model (e.g., is it too bullish on Bill Nelson or too bearish on Heidi Heitkamp?), and I’m happy to address those as well. But this question is important because it highlights a place where the model is trying to price in the limitations of polling and elections forecasting.
Politics isn’t physics—polls just aren’t as precise as electron microscopes, and political predictions aren’t as accurate as what you get in “hard” sciences. But politics isn’t astrology either. We can use the data we have to get a helpful read of what’s going on and what’s going to happen next. And (ideally) good forecasts will try to correctly capture the uncertainty and be prepare readers for the ways in which they could be wrong.