The conventional wisdom about the 2018 House elections was that Democrats won in the suburbs—that is, that college-educated white suburbanites shifted further toward the Democrats, and Republicans (despite also getting a strong turnout) didn’t get enough votes to keep up. That narrative is mostly right, but it’s shaped by a certain type of (important) topline level result —the House popular vote totals, the win/loss record across different districts, etc.
So I tried to expand the scope a little bit by looking at vote totals in different types of districts, comparing the 2016 House results to 2018 and generally trying to take a broad look beyond the normal indicators. And I found some interesting stuff that has real implications for 2018 and 2020.
We’ll start by looking at the vote totals in each district.

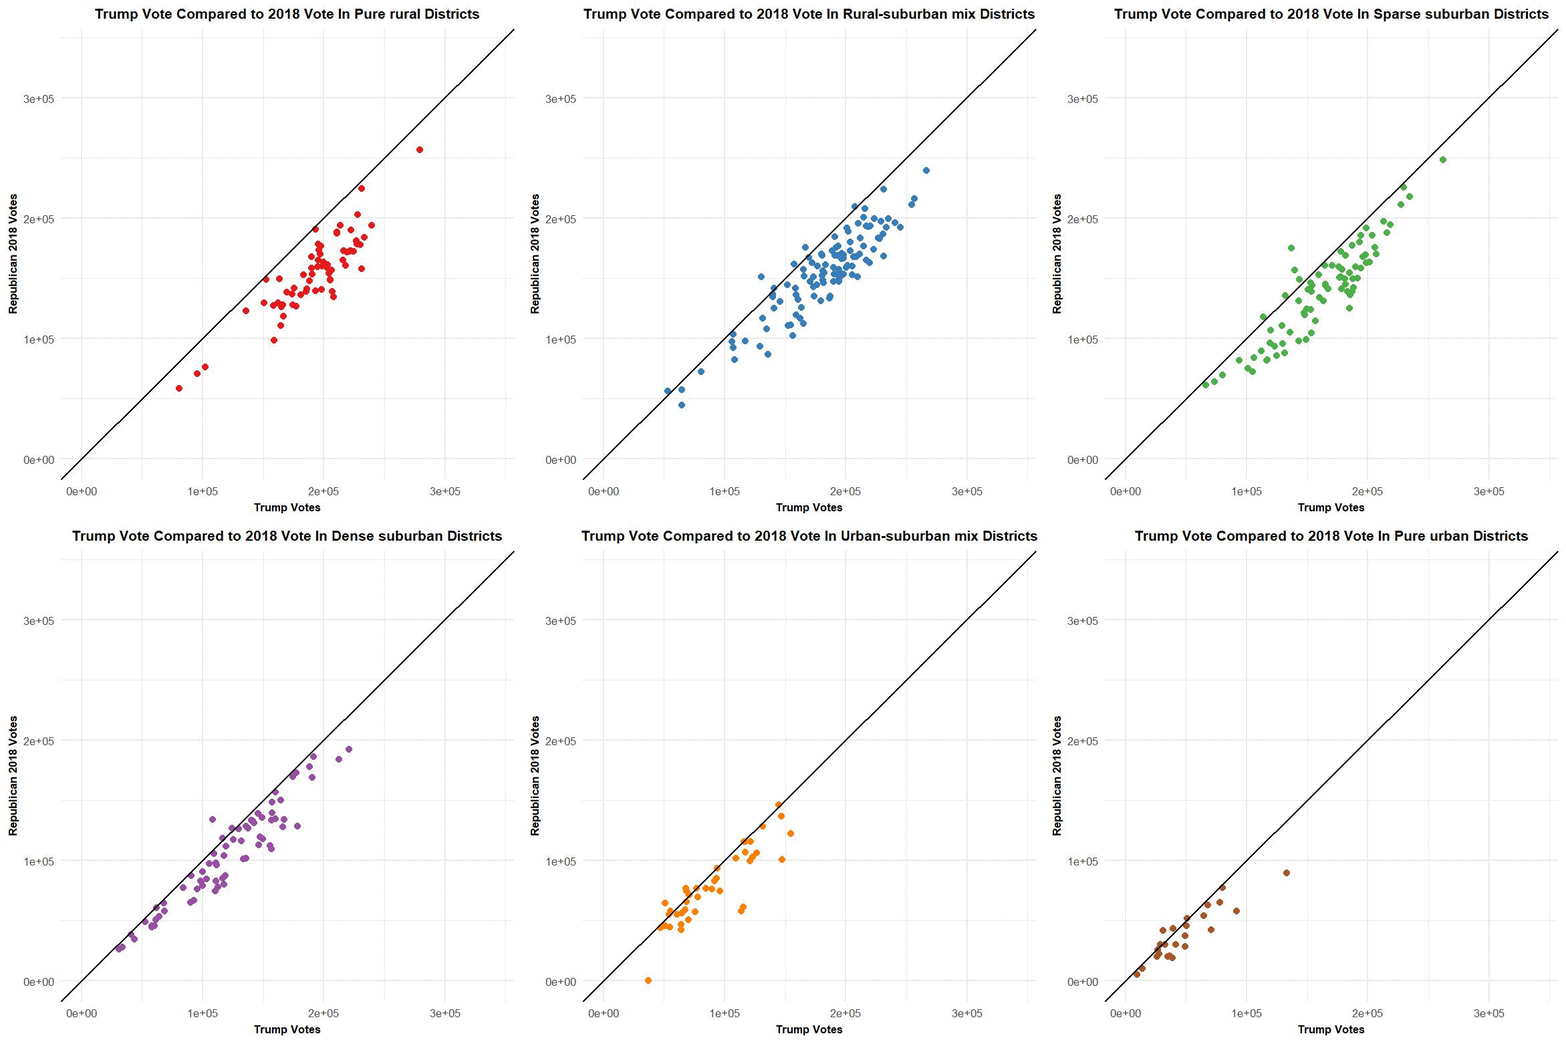
This GIF compares the number of votes for Trump (horizontal axis) to the number of votes for GOP House members (vertical axis) in contested House districts (each point is a district) across districts with different levels of urbanization. Each frame of the .gif compares Trump’s vote total to that of House Republicans in a certain type of district (e.g. pure rural, dense suburban, urban-suburban mix—these categories were taken from David Montgomery over at CityLab and you can read more about them here).
The basic pattern here seems clear—the House Republicans didn’t quite get to Trump’s overall vote total. The House GOP’s vote total (and Trump’s) tends to go down as the GIF progresses. That makes sense: Generally speaking Trump did better in rural areas than he did in denser locations, and the 2018 House GOP followed that pattern.
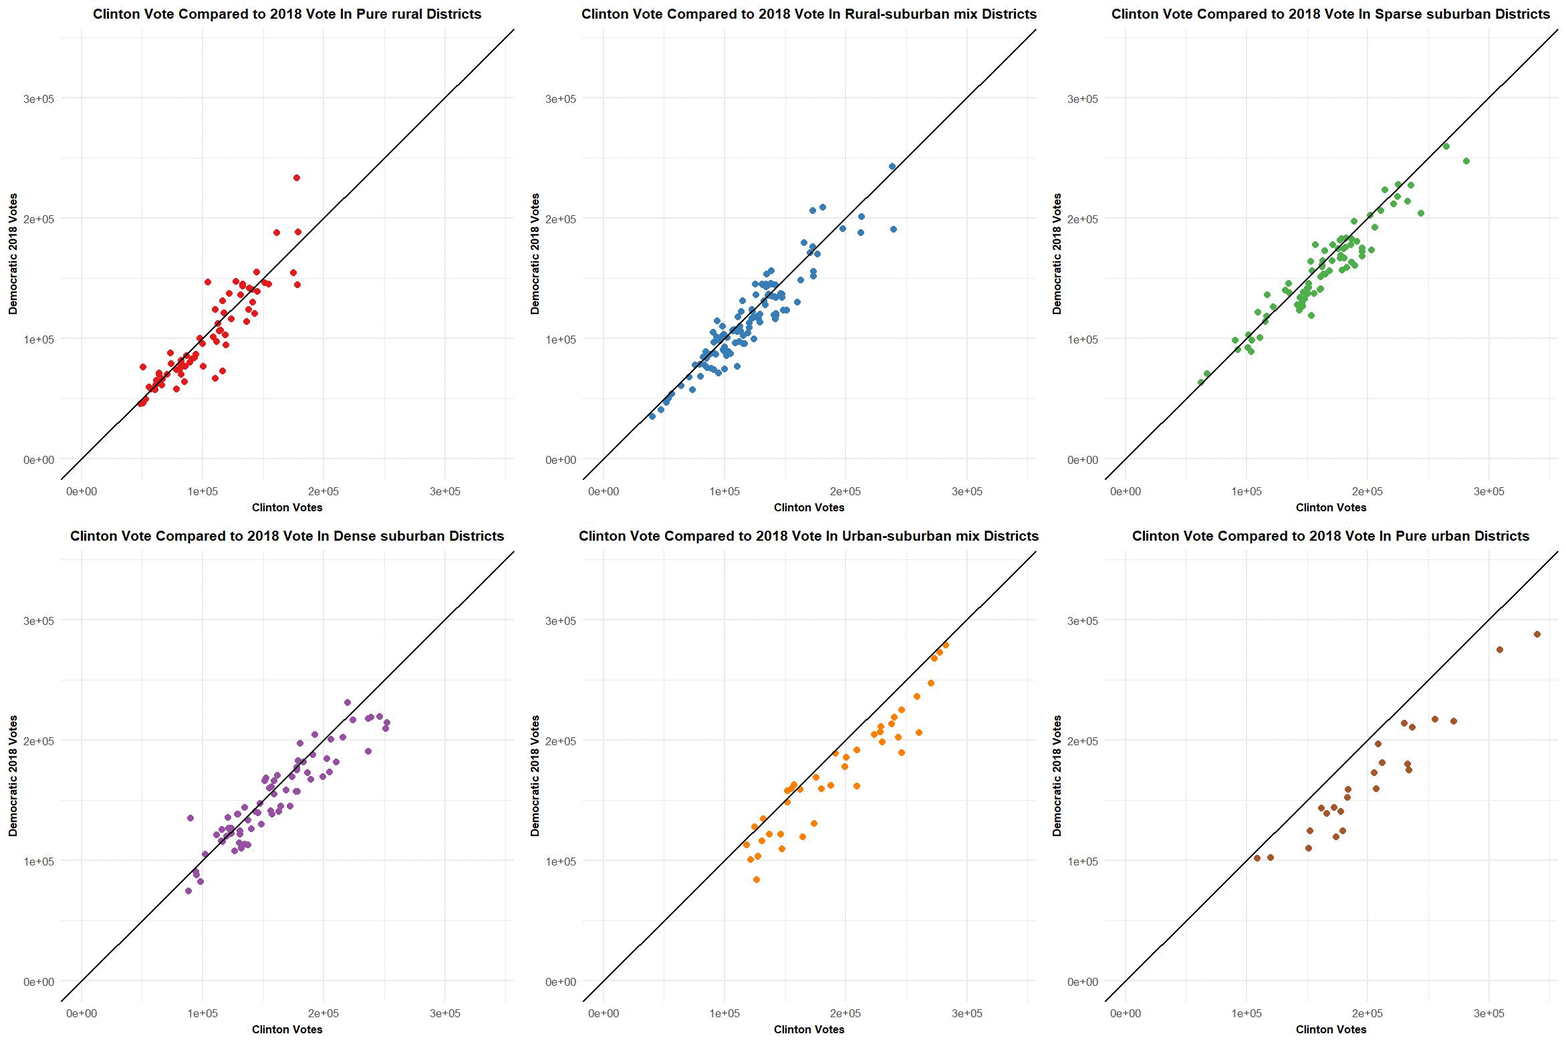
But the graphic takes a different, surprising turn when we substitute Hillary Clinton and the 2018 House Democrats for Trump and the 2018 House Republicans.

As the GIF progresses and we move into more dense districts, House Democrats start to outperform Clinton’s total by larger and larger amounts. In the highly urbanized districts, House Democrats often got more votes than Clinton despite the fact that 2018 was a midterm year.
To me there are a couple of takeaways here.
First, the urban/rural divide is sort of like the gender gap—that is, people assume that a large gap will automatically favor one party, but that’s not really the case. The gender gap was large in 2012, 2014, 2016, and 2018. Republicans won two of those elections and Democrats won two. Similarly, the urban/rural divide (which isn’t hasn’t been as cleanly defined as the gender gap yet) was huge in 2016 and 2018. Republicans won one of those elections, and Democrats won the other one.
Second, the 2018 elections weren’t just a suburban event. Republicans turned out strongly in basically every category, and Democrats seemed to outpace Clinton in a variety of districts. This has implications for 2020. If the GOP continues to hemorrhage votes in denser areas, states like Arizona and Georgia could enter the playing field. Similarly, Democrats could bleed votes in states like Minnesota and Maine if the GOP pushes harder on the rural side of that divide.
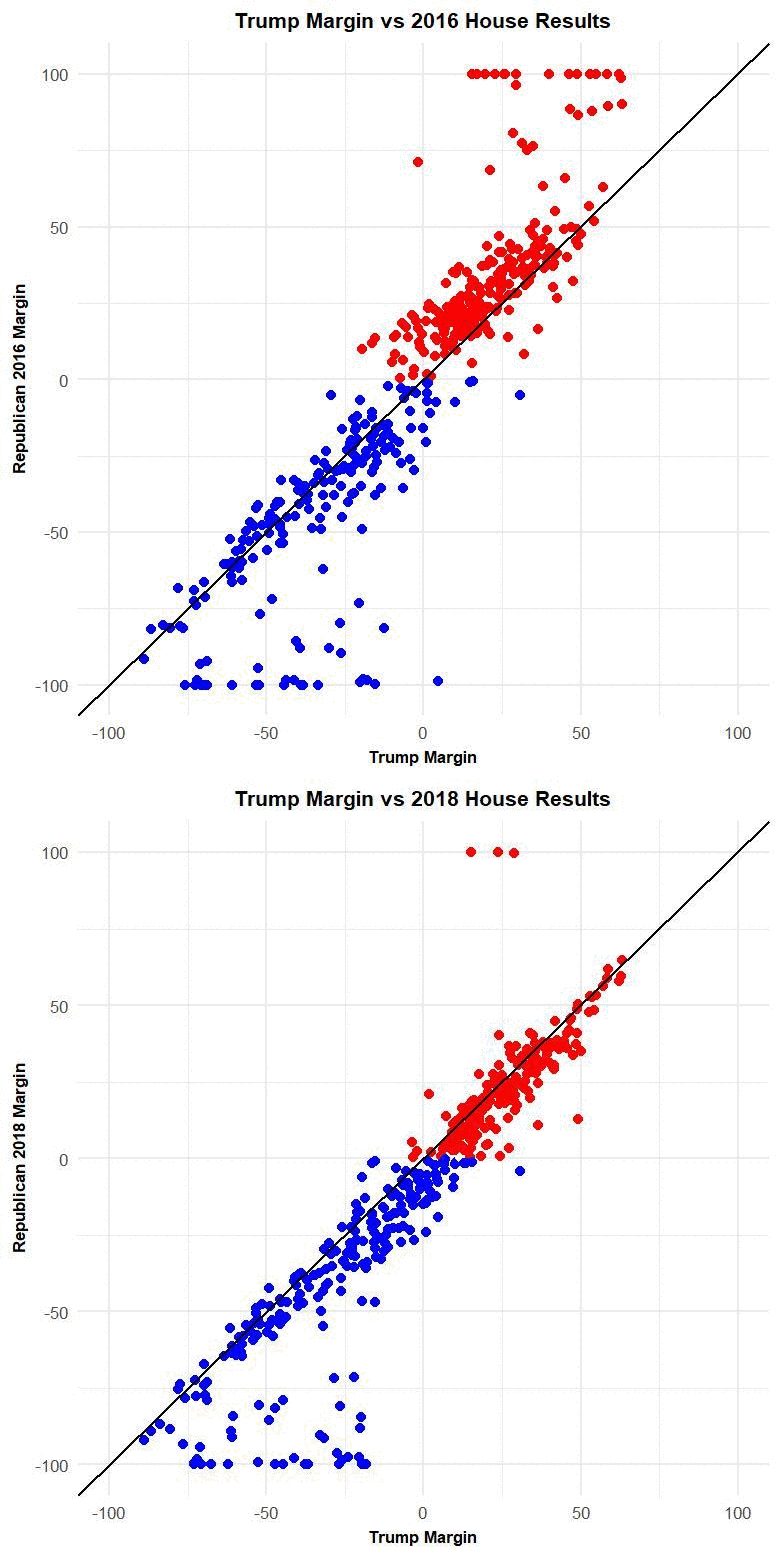
Third, the broader GOP’s clearest path to a victory in 2020 seems to be a combination of winning back voters that it lost in 2018 and 2012. I’ve written at length about the votes that Trump lost (and gained) in the 2016 election—he traded blue-collar white voters (most importantly in the upper Midwest) and lost white-collar suburbanites (most notably in the Southwest), and you can see some attrition between 2018 and 2016 in the graphic above. But it comes through even more clearly when you compare the House 2016 and 2018 numbers to presidential results.

This graphic is similar to one you might have seen over at Echelon Insights. The basic idea here is to show that voters were more willing to distinguish between Trump and the GOP in 2016 than 2018. In 2016, a number of House GOP candidates beat Trump’s margin by a significant amount—suggesting that there’s a real slice of Americans who voted for a House Republican but didn’t vote for Trump. In 2018 (as Echelon pointed out) the House results were more correlated with the presidential results than they were in 2016. This suggests that, after two years of Trump in the White House, voters were more likely to identify their Republican representatives with Trump. And with Trump is as unpopular as he is, that translates into real Republican losses.
It seems like the simplest move for Republicans in 2020 would be to try to regain voters who have cast a ballot for them in the past. There are other options for GOP expansion —a number of right-of-center writers have proposed a sort of multi-ethnic populist front—but Trump (and the current iteration of the GOP) has yet to show that he’s capable of that. But for the short-term, it seems like the first step for the GOP is to figure out how to regain voters they’ve lost in the last four to six years.
And the most intuitive first step for Democrats is to try to keep that from happening. If Democrats manage to replicate their 2018 margins (or even fall short by a moderate amount) in an only-somewhat-higher-turnout environment, they would win in 2020. I’ll write more about Democratic strategy as time goes on, but I don’t think analysts need to overthink either side of this equation. Both parties have a path to a 2020 majority, and it’s not hard to use numbers from the last couple of elections to construct that.

