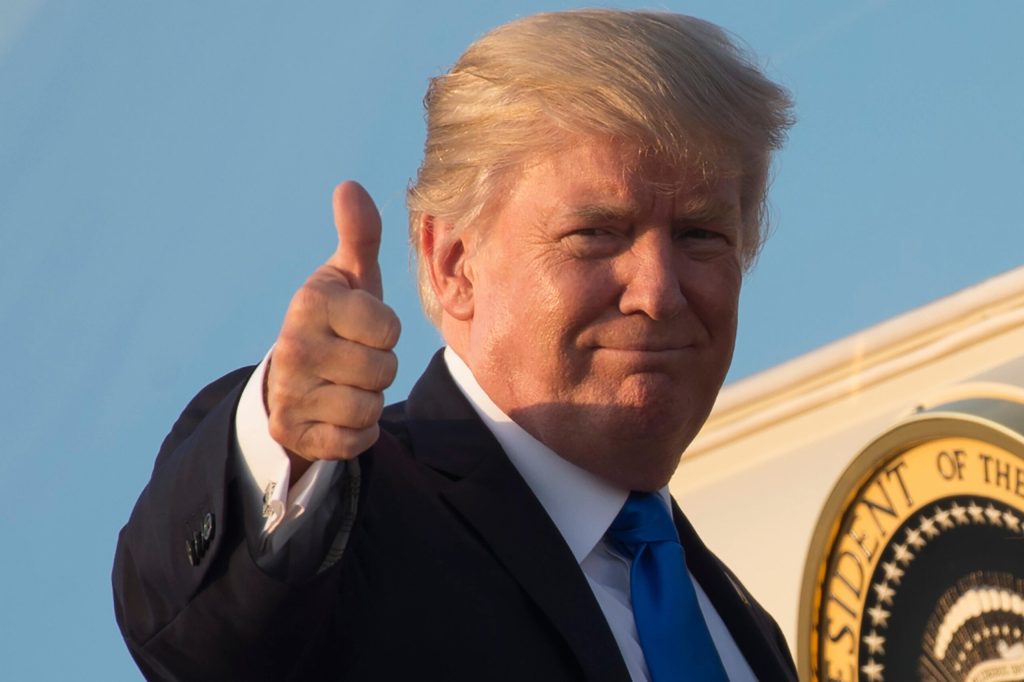
President Donald Trump’s approval rating is probably the most important number in American politics right now. Midterm elections are essentially referendums on the president and his party, so his approval rating will tell us something about what’s going to happen in November. Given that Trump is currently the center of the political universe, t’s hard to understand the ups and downs and the news cycle without having a firm grasp of how the presidntial approval rating works.
I decided to take a long, graphics-driven look at Trump’s approval rating. I used a large dataset of polls (FiveThirtyEight’s polling sans tracking polls) and some un-scary math to try to get a sense of when Trump’s approval changed over the last year and a half. I then marked some important political events on that trendline and tried to see what conclusions jumped out of the data (note that this article is sort of a more graphics-heavy sequel to something I wrote in November of last year).