


The College Board released new annual data on the high school class of 2015’s SAT scores Thursday. See the map below for information on your state’s average composite score.
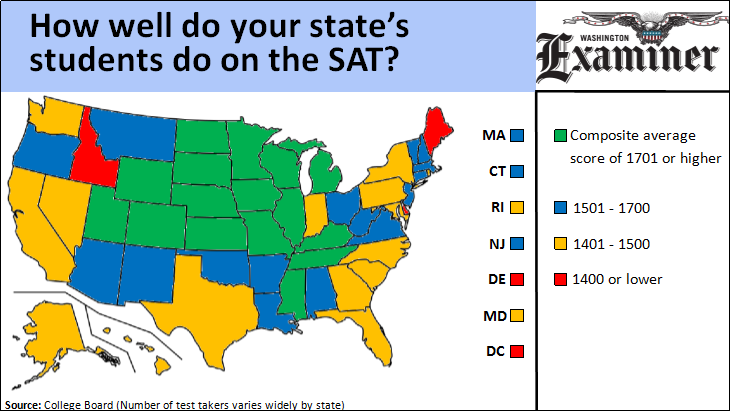
Note that the portion of test takers in a given state has an effect on average scores. As a result, the average scores in a given state are not directly comparable to every other state. Typically, when fewer members of a graduating class take the SAT, the average score tends to be higher. In all four of the lowest-scoring states, 91 to 100 percent of the graduating classes took the SAT. In the 12 highest-scoring states, 10 percent of the graduating class or less took the SAT.
Recommended Stories


Some states require the SAT for all students in their junior year. Students who wouldn’t otherwise take the SAT drive down the average score, compared to states where the only SAT test takers are those doing so for admittance to a certain college.
Globally, the average composite score has fallen to its lowest level since the test was redesigned for the class of 2006. The average combined score for the three sections — critical reading, mathematics and writing — is now 1,490 out of a possible 2,400. (That number includes only college-bound seniors.)
A rise in the number of test takers may be responsible for the falling average composite score. Nearly 1.7 million students in the high school class of 2015 took the SAT. The number of test takers rose by about 26,000 students from the class of 2014.
In March 2016, the College Board will begin administering a revamped version of the test.
