Here are some of my observations on the British elections, in addition to my Washington Examiner pre-election column and my election night Examiner column, plus two blog posts written on the basis of reporting in Cannock Chase in the Midlands and Watford at the edge of metro London and two blog posts written as the returns were coming in on election night after the announcement of the exit poll and after initial returns indicated that the exit poll, unlike the pre-election polls, was substantially right.
1. Historical context
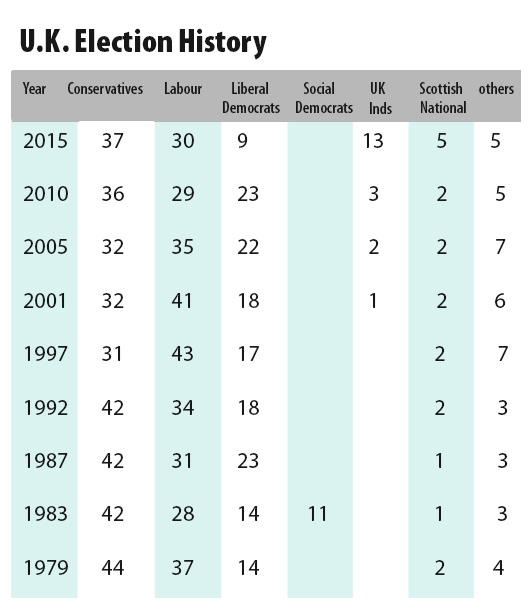
Were the 2015 results far out of line with historic precedent? Not really. In fact, if you look at each party’s percentages of the popular vote, you see that Conservatives and Labour were very close this year to their percentages in 2010. Conservatives have clearly recovered from the trough they found themselves in during the Blair election years (1997, 2001, 2005) but still below the percentages they won in the Thatcher and Major election years (1979, 1983, 1987, 1992).
However, the Liberal Democrat vote evaporated far below the level of all those previous elections and the Ukip (United Kingdom Independence party) did much better and the Scottish Nationals somewhat better than in previous contests (keep in mind that the Scots Nats fielded candidates only in the 59 Scottish seats and not in the 591 English, Welsh and Northern Irish seats).
The following table shows the percentages, rounded off into integers for clarity’s sake for each party over these elections. In addition there are figures for the other (mainly Northern Irish) parties. Also shown is the percentage for the Social Democrats, made up of members who left the Labour party, in 1983; in 1987 the Lib Dems and Soc Dems fielded a joint slate.
Obviously participating in the coalition government dominated by the Conservatives was fatal for the Lib Dems: most of their votes melted away. The party’s voters tend to be pro-European Union, culturally liberal and dovish, and many would have preferred a coalition with Labour.
But Labour plus Lib Dems didn’t have a majority of seats in 2010, and Conservatives worked in advance to be prepared to emphasize policies on which they and the Lib Dem members of Parliament could reach agreement with them. Lib Dem candidates on election night said they had chosen the interest of the country over the interest of the party: a defensible argument.
It looks like most Lib Dem votes went to Ukip, despite the incompatibility of the parties’ platforms. But it appears that many Lib Dems went over the Labour, while Labour lost votes to Ukip, particularly in safe Labour constituencies, while other Lib Dems went over to Conservatives, who in turn lost previous voters to Ukip.
The fact that Ukip’s voters are spread over wide parts of England means they won only one seat in the Commons, while the much smaller number of Scot Nats votes were confined to Scotland, where they won 56 of 59 seats. I suspect there’s a pretty strong resemblance in various constituencies to the percentage voting yes on the Independence referendum in September 2014.
Another way to look at the trends in comparative strength of the two major parties is the combine the Conservative and Ukip vote on one hand and Labour and the SNP on the other. The following table shows those numbers from 1979 to 2015.
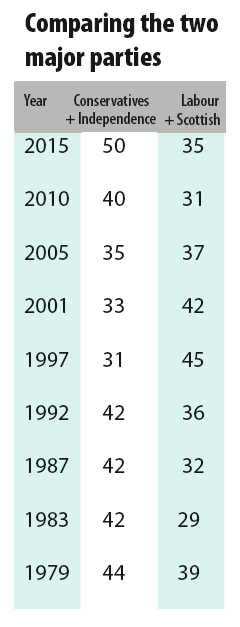
The Conservative/Ukip margin in the Thatcher-Major elections was very large, as was the Labor/SNP margin in the first two Blair elections. The Labour margin dropped in 2005, in part I think because anti-Iraq war moved to Lib Dems, whose share rose four points between 2001 and 2005.
The 2015 Conservative/Ukip margin is, I think, misleadingly large, since a look at the election returns as they came in has convinced me (though I am open to persuasion based on a closer review of the numbers) that Ukip numbers held up well in safe Labour and perhaps safe Conservative districts, but tended to go over to Conservatives in marginal seats.
As I mentioned in my election night column, Britons are accomplished tactical voters: in the Blair elections tactical voting was anti-Conservative, resulting in the lion’s share of anti-Conservative votes going either to Labour or Lib Dems, whichever was perceived to be stronger in the constituency; this helped to elect many of the Lib Dem MPs who were defeated or replaced by other parties this year, and there was some anti-Iraq war tactical voting against Labour in 2005. Which gets me to my second point:
2. Why were Conservatives able to get a majority in 2015 when they weren’t able to do so in 2010 with a similar popular vote margin over Labour?
The first answer is that this year they had more incumbents, who had been able to perform constituency services over the past five years: that can be good for 1 or 2 percent and occasionally more: the difference between victory and defeat in a target seat. I noticed this tendency in the Watford constituency, where the hard-working Conservative Richard Harrington was re-elected by a wide margin in a seat which was close in 2010 and in which Conservatives finished third in 2005.
The second and more important reason — though here I am speculating — is that the Conservative campaign, run by the Australian campaign guru Lynton Crosby, seems to have targeted districts shrewdly and bombarded them with messaging emphasizing especially the dangers posed by the possible Scots Nats dominance of a Labour government.
Perhaps in some places this included a high-minded appeal not to break up a Union which has existed since 1707 and under whose Union Jack flag Scots and Englishmen fought and died in battles that saved the world from tyranny. The more typical message would be similar to the Conservative billboard showing former SNP leader Alex Salmond picking a man’s pocket and urging voters not to let the Scots Nats steal their cash.
The appeal might be aimed particularly at Ukip sympathizers and supporters: the only way to stop the Scots stealing your money is to vote Conservative. My hypothesis — I need to see more evidence on this — is that prompting Ukippers to vote Tory is the best explanation of why Labour won so few of the Conservative seats it targeted in England and Wales, and why Conservatives managed to take Labour seats there in significant numbers. If you compare the district projections, based on the pre-election polls, in this Telegraph graphic with the results in this Guardian graphic, I think you will see what I mean.
I will reserve more observations, on the polls and on the election of the youngest member of Parliament since 1667, for a later blog post.