Last night, a Democratic candidate won a Senate seat in deep red Alabama.
Let that sink in.
Alabama is one of the worst places in the country to be a statewide Democratic political candidate. Not only is it highly Republican, but it’s inflexible. The national conditions that shift swing voters towards one party or the other don’t always move many Alabamians—yet Jones managed to pull off a win anyway.
So what should we learn from this race? I have a few takeaways.
(1) Candidates Matter
Roy Moore wasn’t a generic Republican candidate. If you’ve ready anything about this race, you know that the Washington Post and other news outlets have published credible claims that Moore had improper sexual contact with teenage girls while he was in his 30s. And even before that, Moore was controversial. He was elected as Chief Justice of the Alabama Supreme Court twice, but he was removed from that position in 2003 and suspended from it a few years after winning the seat back in 2012. He won his 2012 election to that position by four points while Romney won the state by 22 points.
In other words, Moore was a terrible candidate. And that mattered.
According to a model Sean Trende and I developed at RealClearPolitics, a problematic Republican candidate in a state as Republican as Alabama would, given a low approval rating for Trump, get about 47 percent of the vote and lose the majority of simulated elections. Jones won the election, and Moore wasn’t too far off that 47 percent benchmark.
And it’s possible to argue that Moore was even worse than your run-of-the-mill “problematic candidate.” According to exit polls (which have their issues but are still useful), Trump’s approval rating in Alabama was nearly equal to his disapproval rating, indicating that some Trump-friendly voters might have stayed home to avoid voting for Moore or Jones. Moore might not have even needed his recent scandal to drive down turnout—he was underperforming a generic Republican before the Washington Post published the allegations against him, and we already saw lower turnout in Trump-friendly areas in the Virginia gubernatorial election.
But no matter how you look at the race, it’s hard to escape the fact that Moore was a truly bad candidate, and that Republicans likely would have performed significantly better if they had nominated a more conventional Republican.
(2) This is HUGE 2018 News
Jones’ win significantly increases the chances that Democrats will retake the Senate in 2018. To see why, just take a look at the Senate map.
Had Moore won, Democrats would have had a very difficult path to a majority in the upper chamber. They would have had to hold every one of their seats (some of which are in highly Republican states, such as West Virginia, Montana, Missouri, Indiana, and North Dakota), win an open contest in Arizona, unseat Sen. Dean Heller in Nevada and win one other state—presumably Tennessee or Texas.
That’s not easy. Take a look at these results from the RCP Senate Simulator I mentioned earlier:
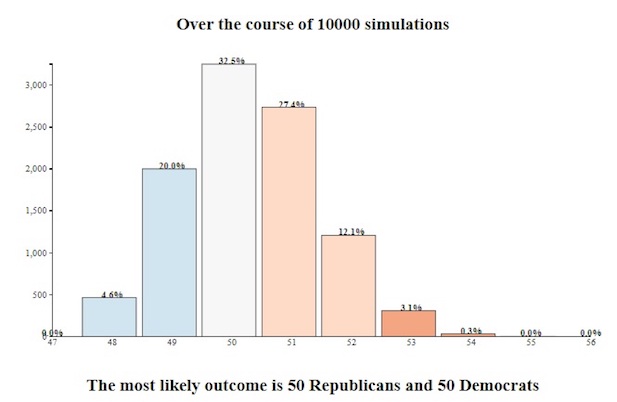
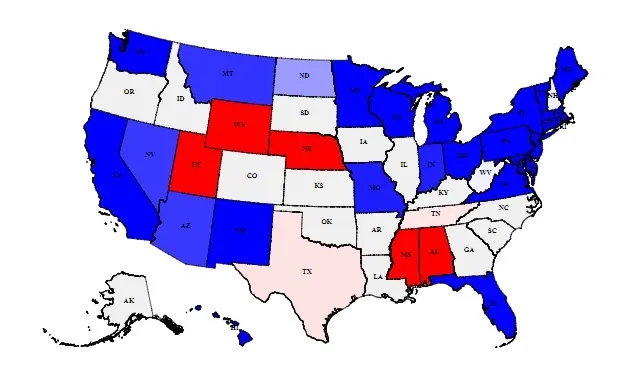
The first graphic shows the results of 10,000 simulated versions of the 2018 senate elections given assuming that Moore held onto the Alabama seat and that Trump’s approval on Election Day 2018 is about where it is now. The second graphic shows state-by-state win probabilities for each party (again, assuming that Republican won the Alabama seat).
As you can see, the most common result in this model is a 50-50 split. Democrats were at times able to take Tennessee, Texas, or both. But those weren’t the most likely outcomes.
Jones’ win in Alabama changes this calculus. Democrats no longer have to look to Tennessee or Texas (both of which are very red) for their 51st vote in the Senate. They simply need to defend all of their seats while winning Nevada (a purple state) and Arizona (a state that should be in reach for them if Trump’s approval rating stays where it is today). This transforms Tennessee and Texas from states that Democrats must win to get the majority to optional gains that could either pad their majority or make up for potential incumbent losses.
(3) How Jones Won—Some Basic Demographic Data
It usually takes some time to fully evaluate every demographic detail about a major race. But, using county-level data and exit polls, we can start to put together a picture of exactly how Jones pulled off his win.
Jones won a substantial number of white voters. According to exit polls, Jones won 31 percent of white voters and 96 percent of black voters. Typically, Democrats win large majorities of black voters in southern states while losing many white voters. In 2012, the exit polls showed President Obama earning 15 percent of the white vote. And while exit polls do have their disadvantages, it’s worth noting that the New York Times’ Upshot also estimated that Obama won 16 percent of the white vote in 2012. Jones did significantly better with white voters while still holding onto lopsided margins with black voters.
African-American voters also seemed to turn out for Jones. FiveThirtyEight calculated the turnout rate for each county in 2016 and 2017 as well as the difference between the two. In counties with a larger black population, the drop-off in turnout from 2017 to 2016 was lower. In other words, black voters showed up for Jones while other groups were comparatively less energized.
It’s also worth noting that some familiar battle lines showed up in the exit polls. White voters with a college degree were more likely to vote for Jones than white voters who didn’t have a degree. There was also a gender gap—white men were more likely to vote for Moore than white women. Exit polls are just one tool for understanding the electorate, but these results make sense given what we’ve seen in other recent elections.
In the coming days and weeks, more thorough analyses will help us understand the demographics of both Moore and Jones voters. But these numbers provide a helpful overview.
(4) Pollsters Disagreed and That’s Not a Bad Thing
According to the vote count as of last night, Jones beat Moore by less than a percentage point. That’s not too far off the polling average, but it’s very different from what some of the polls said—recent polls showed results ranging from a 10-point lead for Jones to a 9-point lead for Moore. There’s more than one reason that the polls diverged (more on that here), but some polls were closer to the result than others.
Believe it or not, that’s a good thing.
It shows that pollsters aren’t herding. Herding is a practice where pollsters adjust their results to match other pollsters. If Polling Company A doesn’t want to risk looking like an outlier and calling an election incorrectly, they might change their baseline assumptions so that the results of their poll turn out more in line with the average. This practice might save an individual pollster some temporary embarrassment, but in the long run, herding is bad for everyone and harms the accuracy of polling averages.
So it’s good that in a race that was hard to poll, pollsters felt free to come up with wildly divergent results. It will help everyone figure out which methodological choices lead to the best results and that knowledge, along with data from many other previous elections, will help us better understand public opinion in future races.