Next Tuesday, we’ll finally know whether Republican Roy Moore or Democrat Doug Jones will become the next Senator from Alabama.
But next Wednesday, there will still be so many questions about this race. How did voters respond to the credible allegations that Moore, while in his 30s, had improper sexual contact with teenage girls? Did Jones get more votes than a generic Democrat would have? If Jones’s platform was less liberal, would he have performed better? Did Moore’s prior unpopularity matter more or less than these new allegations?
Recommended Stories


I could go on, but the point is that there’s more to this race than who will simply win. And many of these other important questions revolve around whether Moore or Jones performed well compared to some baseline result. For example, if we want to know how poorly Moore performed compared to a generic Republican, we need to have a baseline for how well a generic Republican typically performs. Or if we believe that Jones would have performed better if he was less liberal, we need to get a ballpark for how well a more moderate Democrat might have performed in the state.
There are numerous questions along these lines and many different baselines that would help us answer them. But rather than attempt to exhaustively list all of them and do the appropriate calculations, I zoomed in on three different baselines that I think will help us think about whatever happens next week.
Baseline One: Generic Candidates in a Normal Year
I don’t think that Roy Moore is going to perform as well as a generic Republican senatorial or presidential candidate would. He has a lot of baggage (not limited to the revelations of the last month and a half), which might discourage some Republican voters from turning out or cause them to vote for Jones or a write-in candidate. But it’s still worth getting an estimate of how Republicans perform in a normal year so that we can compare Moore to that.
Getting a baseline in Alabama is easier than in most states. That’s because Alabama is what others have called “inelastic” and “racially polarized”— that is, white voters cast their ballots overwhelmingly for the Republican candidate in nearly every election, and black voters reliably vote for the Democrat. Moreover, white evangelical voters (who are plentiful in Alabama) and black voters are some of the most reliable constituencies for Republicans and Democrats, respectively. In recent years, that’s added up to Alabama election results bouncing around in a relatively narrow range.
For example, Republicans earned 50.7 percent, 45.7 percent, 47.2 percent and 46.1 percent in the the national presidential popular vote in 2004, 2008, 2012 and 2016 respectively. That’s a significant range, including a solid Republican win (2004) and a landslide Democratic victory (2008). But the results in Alabama don’t vary as much—Republicans got 62.5 percent, 60.3 percent, 60.6 percent, and 62.1 percent of the vote in those same years.
In the Senate we see a similar pattern. Sens. Jeff Sessions and Richard Shelby—the incumbents before Sessions became attorney general—often got into the low-to-mid 60s range of the overall vote. During the 2008 Democratic landslide, Sessions won 63 percent of the vote and during the 2010 Republican wave Shelby earned 65 percent. In other words, the senatorial and presidential results in Alabama have recently been pretty insensitive to the tides that give one party the presidency or allows another to retake the House (for more on elasticity and Alabama, see great pieces by Nate Silver, Nate Cohn and others).
So what does this mean for Roy Moore? It suggests that if a more generic Republican were running in a normal year, a good starting guess for his or her vote share would be in the low 60 percent range with the Democrat taking almost all of the rest of the vote. You could easily make the case that this is too rosy of an estimate for the Republican—that special election turnout and Trump’s low approval rating would significantly shift this race toward the Democrats as it has in many special elections since 2016. And that’s fine—this isn’t meant to perfectly describe where a generic Republican would be this year, but to give us an educated starting point for thinking about Alabama and how this race might compare to a more typical one.
Baseline Two: Bad Candidate, Unpopular President, Normal Elasticity
This first baseline is helpful, but it doesn’t tell us much about how Roy Moore, a problematic candidate, should perform in a national environment that favors Democrats. That’s what Baseline Two is for.
I used a simple regression model that I built with Sean Trende (the same one referenced here and here) to estimate what percentage of the vote a more generically problematic Republican candidate (think Todd Akin, Richard Mourdock or Christine O’Donnell) would get in a state with Alabama’s partisan lean when Trump’s approval rating is about 40 percent. According to that estimate, that candidate would get about 47 percent of the vote. That’s not far off his current polling average.
That’s not to say that Moore is a run-of-the-mill problematic candidate. This model has a great track record, but it doesn’t take Alabama’s inelasticity into account and it assumes a more normal general or midterm election level turnout. There’s also (as is the case with any model) uncertainty around the estimate. Moreover, as Silver notes, Moore is underperforming the average Republican by about 25 points due to the combination of his previous baggage and his recent scandals.
So if you’re looking for a baseline for what a more typically problematic candidate might get in Alabama, you could argue that 47 percent is too low (I think it is). But, wherever you think the baseline is, these numbers provide a helpful starting point for figuring out exactly how problematic of a candidate Moore is.
Baseline Three: Moore’s Past Performance
Roy Moore isn’t new to Alabama politics. He’s been elected as chief justice of the state’s Supreme Court twice, and he’s been removed from that office twice. He also ran in multiple gubernatorial primaries. And his most recent election gives us some clues about how Alabamians feel about Moore in particular.
In 2012, Moore barely won a race against Democrat Bob Vance (not that Bob Vance), who ran as a moderate
.
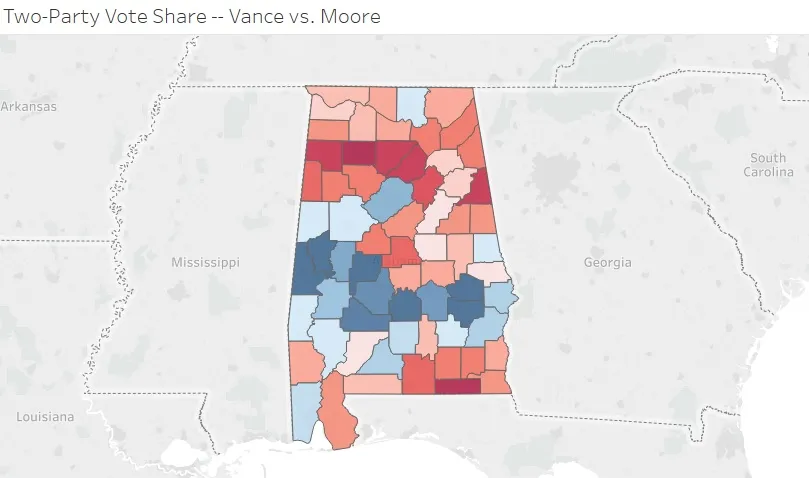
Parts of this map make sense. Vance won a stretch of counties in central Alabama where many black people live and vote as well as Jefferson County (home to Birmingham; it’s the northernmost county in that big continuous blob of blue counties in the middle).
But at the same time that Moore won a relatively close race, Mitt Romney won the state in a 22 point landslide victory.
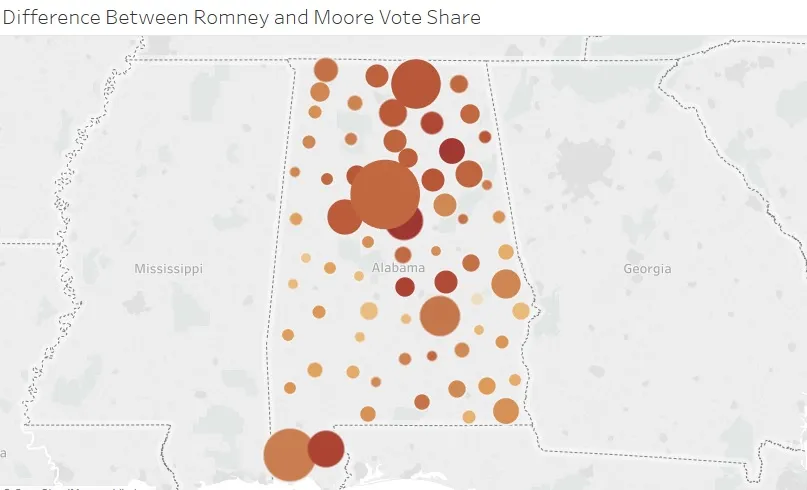
This map shows the difference between Romney’s and Moore’s vote share on the county level with each county sized according to the number of votes it cast for major party presidential candidates in 2012. In other words, big brown bubbles are populous areas where Romney ran well ahead of Moore and smaller, less brown bubbles are less populous areas where Romney didn’t run as far ahead of Moore.
The message of this map is simple. In some of the more well-populated areas of the state (think Birmingham, Mobile, and Huntsville) Romney got a much larger share of the two-party vote than Moore, while Romney and Moore won more similar vote totals in areas that were more heavily black and rural. In other words, black voters who cast their ballot for Obama also typically voted for Vance, and some white voters (particularly upscale whites) likely voted for Vance and Romney. Results of some basic regression analysis backs up these claims: the black percentage of the county population and median income together explained about two thirds of the variation in where Romney outpaced Moore (for more reading on Moore’s electoral past, see these pieces).
This baseline is a little different from the other two in that it’s not one simple number. But it’s helpful for understanding exactly what Moore’s baseline performance was like in his most recent election. Moreover, understanding the contours of this race could help us answer questions about next week’s results—if the polls are right and Moore substantially underperforms more generic Republicans, we’ll be able to use this data to get a more accurate sense of whether Vance and Jones flipped the same people regardless of their differing political styles.
Where Does This Leave Us?
This analysis only starts to get at a few questions about this race, and there’s reasonable ways to adjust or set completely different baselines for how Moore or Jones might perform. But if we’re going to understand the final results in Alabama, it’s worth trying to set these benchmarks ahead of time. That will (hopefully) help us draw more principled conclusions about which candidates overperformed and underperformed various standards and why.