It’s one of the most-cited statistics among critics of President Obama’s stewardship of the economy: Nearly 90 million adults have left the labor force, and labor force participation has fallen even as the economy has recovered.
Those people, 87.4 million of them to be more specific, are neither working nor looking for work. That means they are not included in the official unemployment rate even if they would like a job.
Just what these people are up to, and why they have dropped out of the workforce, became a little clearer on Wednesday, when the Bureau of Labor Statistics published charts and tables describing the part of the population that is out of the labor force, and how that group has changed since 2004.
The change helps illuminate just how much of the drop in labor force participation can be blamed on the weak recovery and put on Obama’s record, versus how much is attributable to demographic changes. It’s a major question facing the U.S., as labor force participation has fallen from 66 percent at the start of the recession to under 63 percent today, and is expected to keep dropping for the next decade.
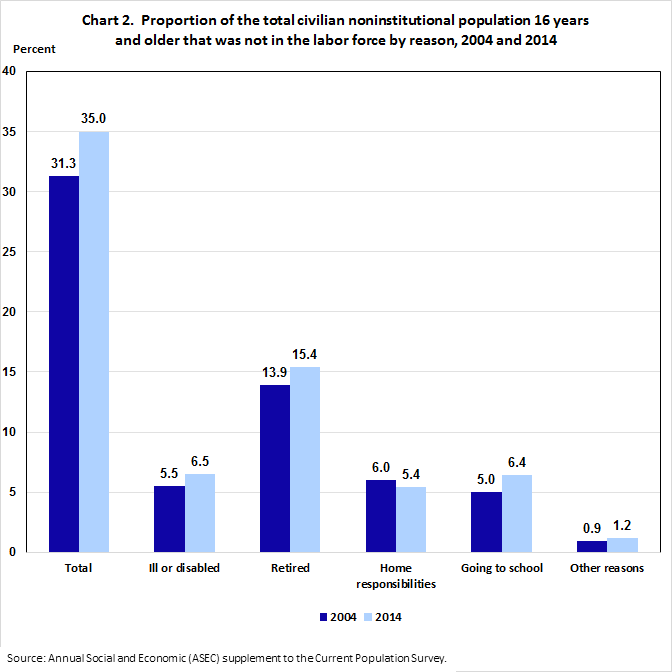
The BLS statistics illustrate one fundamental fact about the oft-cited 90 million figure: The majority of those people are folks who wouldn’t be working in any case, regardless of what was going on in the economy. Fully 34 million are older than 65, the vast majority of them retired. Another 13.5 million are working at home, 16 million are in school, and 16 million are sick or disabled.
As for the drop in labor force participation since 2004, here’s where all those people went, as of 2014:
The biggest increase, of 7.2 million, came among people who retired. That is partly because of the aging U.S. population, with more baby boomers reaching retirement age in recent years:
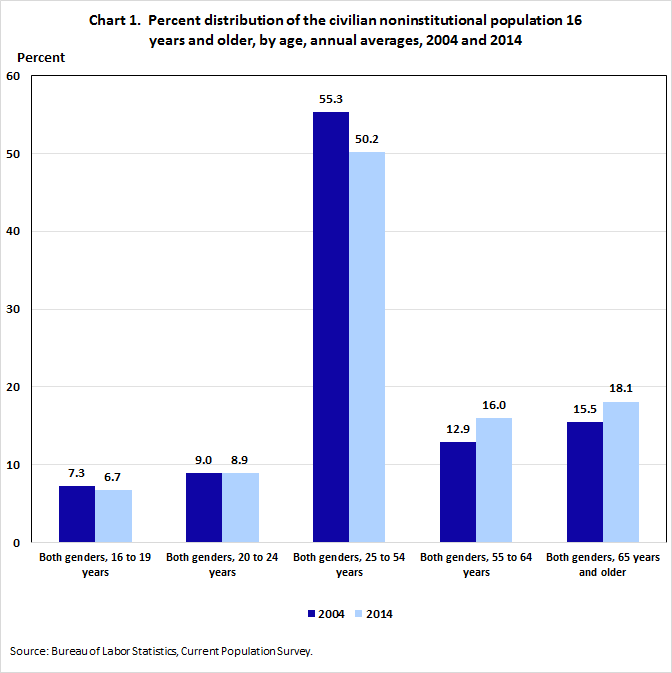
Note, however, that although the total number of retirees rose, seniors became less likely to retire and more likely to work. Retirement surged overall because the effect of aging swamped the effect of older people working more:
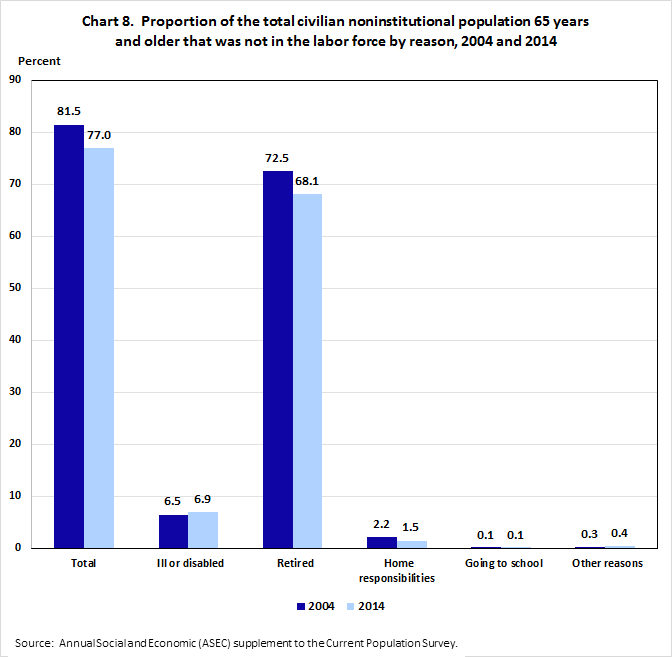
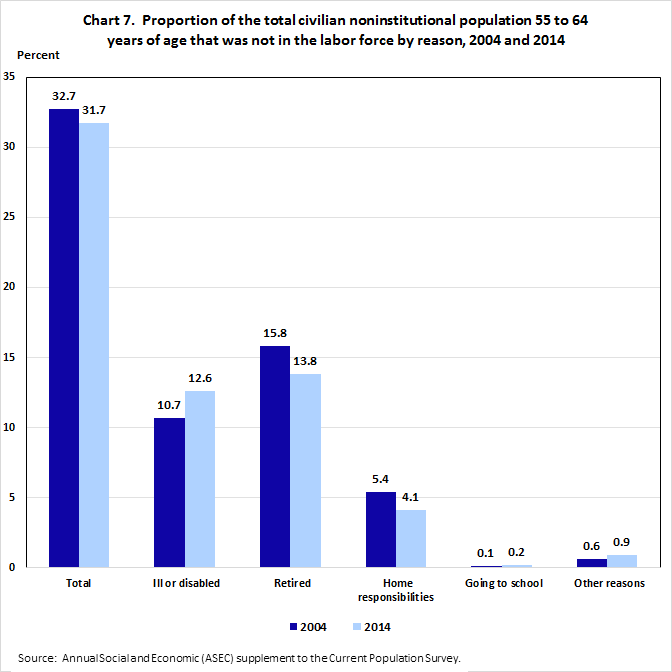
For people nearing traditional retirement age, retirement became less popular. Disability, however, became markedly more popular.
Meanwhile, young people turned away from work and toward more years of school:
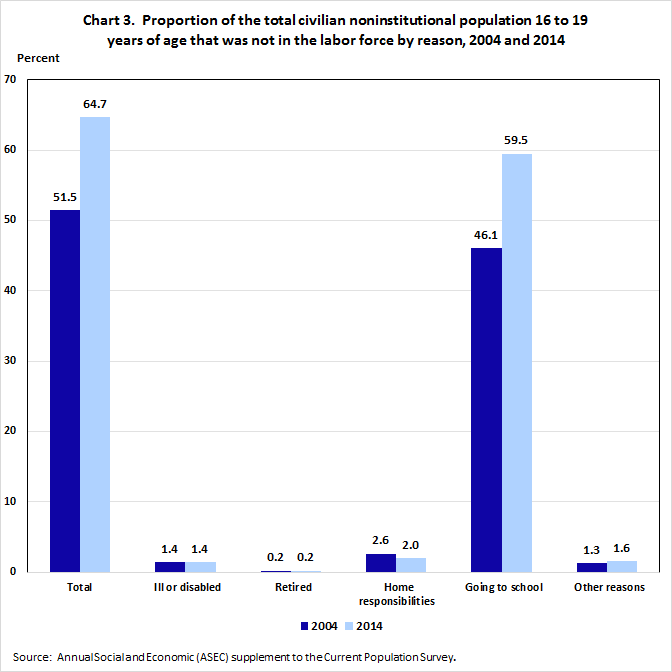
What’s not clear, and what can’t be answered by this chart, is how many young people chose to go to school because they wanted more education and how many tried to wait out the recession in school.
Similarly, these breakdowns don’t show how many people retired because they wanted to, versus how many retired earlier than they may have wanted because they couldn’t find another job. The same goes for disability: It’s possible that people capable of doing certain kinds of work couldn’t find jobs in those areas because the economy is weak, forcing them to seek government benefits.
Outside analyses have tried to guess at which factors have made the most difference. The nonpartisan Congressional Budget Office in June 2014 calculated that roughly half of the decline in labor force participation through that point was attributable to the severity of the recession and the weakness of the recovery. The White House Council of Economic Advisers reached a similar conclusion in July 2014.
Since then, the economy has added roughly 3.8 million payroll jobs, and the number of advertised job openings has risen from 4.7 million to 5.4 million, suggesting that the outlook is much brighter for people who do want jobs.
Nevertheless, just how many people currently outside the labor force would like jobs is a major question looming over 2016, one with particular relevance for the Federal Reserve as it weighs how fast to raise interest rates.
This post has been updated to correct the number for the increase in people who are not working because they have retired.