For most of the Trump Era, most major special elections have followed a pretty predictable script: a Republicans leaves office (either to join the Trump administration or in the wake of a scandal), a special election is set, the Democratic candidate hugely outperforms the district’s baseline partisanship (sometimes even winning the district) and election wonks get more evidence that Democrats are on track to perform well in the upcoming midterms.
But Republicans caught a bit of a break in Saturday’s special election in Texas. Republican Michael Cloud won 55 percent of the vote in Texas’s 27th district on Saturday, filling the seat vacated by Blake Farenthold (who settled a sexual harassment claim using taxpayer dollars). Cloud avoided a runoff by getting over 50 percent against a crowded field of Democrats, Republicans and Independents. His 55 percent isn’t so far off the 60 percent that Trump won in the district in 2016, and the combined Republican vote share was very close to Trump’s overall percentage.
This is a good data point for Republicans. To get a sense of how good, look at this graphic.
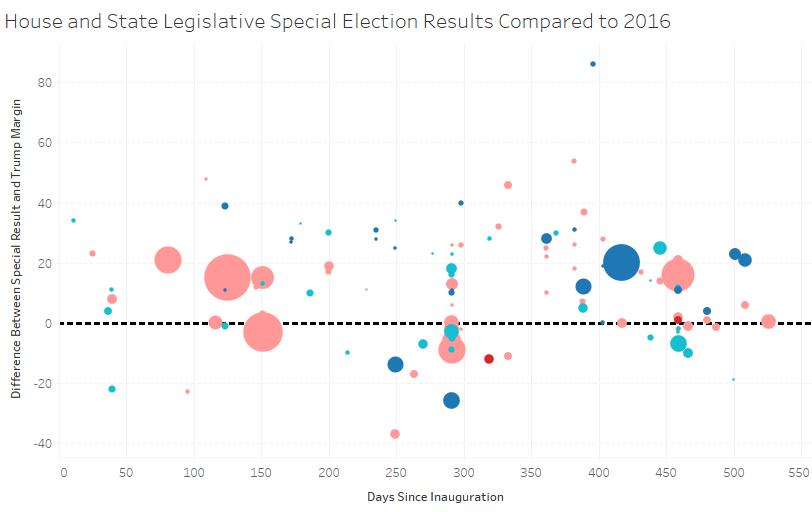
The basic idea here is to put together a calendar of special election results compared to a sensible baseline (skip this paragraph if you’re not interested in the details or have seen an earlier version of this graphic). Each point is an election, and time runs chronologically from left to right. If Democrats outperformed Hillary Clinton’s margin by a large amount, the point will be high above the dotted line, and if the Republican outperformed Trump by a wide margin, it’ll be far below it. The color indicates the result—dark blue is a Democratic gain, light blue is a Democratic hold, pink is a Republican hold and dark red is GOP win. Finally, bigger dots indicate that more people voted for the major party candidates. Data is from Daily Kos Elections and Geoff Skelley of Sabato’s Crystal Ball.
Texas’s 27th District is the small pink point sitting on the dotted line near the end of the graphic.
The GOP performed much better here than they have in many other major special elections. In Montana’s at-large district, South Carolina’s 5th, Pennsylvania’s 18th, Kansas’s 4th, Arizona’s 8th and Alabama’s Senate race, many more voters turned out and Democrats outperformed Clinton by a wide margin (sometimes by 20 points). This isn’t the first time Republicans have posted a decent showing (e.g. Georgia’s 6th District and Utah’s 3rd count as overperformances, though Trump was much weaker in both districts than Mitt Romney had been in 2012), but it’s much better than what they’ve seen in recent House elections such as Arizona’s 8th and Pennsylvania’s 18th.
Republicans should be happy with this result, but they shouldn’t overinterpret it. The turnout was extremely low (which is why the dot is so small) and it’s unclear how the result would have changed if it was higher. Maybe more importantly, the special election data is noisy. The graphic above features stratospheric Democratic overperformances as well as strong GOP overperformances. So the best approach is to take a look at the sum of evidence rather than just one data point. And so far, special elections (especially House specials) suggest that public opinion strongly favors the Democrats heading into November.