
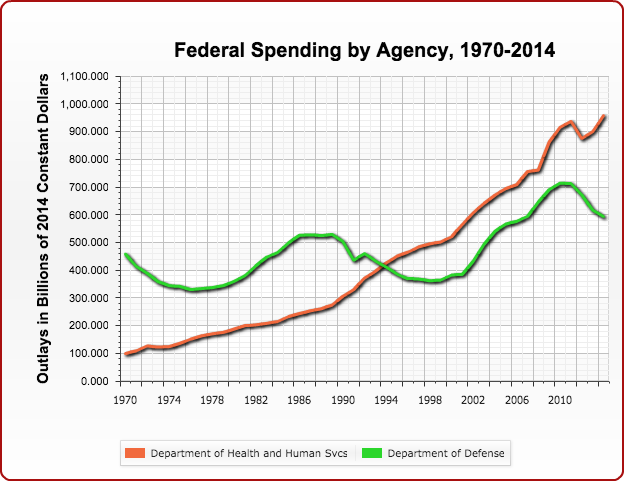
Chris Edwards of the Cato Institute has launched a great new tool for understanding federal spending trends since 1970. It’s the “Make Your Own Spending Chart” interactive on downsizinggovernment.org.
You just check whichever federal department you want to graph and it appears on the chart just to the right. Then just right-click on the chart if you want to save it.
Recommended Stories



Print subscriber? Click here to login/register your account
Digital subscriber? Click here to login/register your account.